Designing a Transparent, Trust-Driven Product LCA Experience for Dairy Manufacturers
Company: Sproutfull
Role: UX Engineer (UX + Frontend)
Timeline: Multi-month, shipped iteratively
TL;DR
designed and implemented Sproutfull’s product-level LCA workflow to make complex lifecycle calculations traceable, explainable, and defensible in live workshops.
By structuring the experience around lifecycle stages and encoding traceability directly into the component model, I reduced interpretation workflows from 20+ manual steps to ~6 and removed reliance on LCA experts during reviews.
What I built
I owned the design and front-end implementation of Sproutfull’s product-level LCA workflow.
The system enables sustainability teams to inspect, explain, and act on lifecycle impact data in real time, without relying on spreadsheets or expert mediation.
My ownership
I ran this work end to end. I conducted user research with sustainability leads and LCA specialists, mapped the workflow, designed the interaction model, and implemented the UI in React/TypeScript.
I worked closely with data engineers on inputs, validation, and traceability so results stayed auditable. I acted as the bridge between UX, data, and engineering, ensuring interaction decisions were feasible, performant, and traceable in production, not just in design.
The problem
Existing LCA tools surface a single score but fail at interpretation.
In practice, sustainability teams need to answer:
What changed?
Why did the score move?
Which lifecycle stage drives impact?
Which assumptions and emission factors are responsible?
Without clear traceability, teams lose trust in results, reviews slow down, and experts are pulled in just to explain numbers.
Technical Contribution
Built a production-ready LCA workflow using Next.js, React and TypeScript, translating complex lifecycle models into structured UI components
Defined the component architecture around lifecycle stages, enabling traceability, progressive disclosure, and scalable data interaction
Worked closely with backend and LCA specialists to align data structures, calculations, and UI representation
Encoded domain logic (lifecycle stages, assumptions, traceability) directly into the UI to reduce reliance on external interpretation
Designed for performance and clarity when handling dense datasets, balancing usability with auditability
Acted as the bridge between UX, engineering, and domain experts to ensure feasibility and accuracy in production
Outcome
Reduced interpretation workflows from 20+ manual steps to ~6 structured steps
Enabled teams to spot hotspots in seconds during review
Made score breakdowns explainable without relying on sustainability experts
SELECTED SCREENS
A production-ready LCA workflow designed to handle complex data with clarity, consistency, and restraint.
OVERVIEW
Context, users, and constraints
Context
Sustainability teams needed to:
Inspect lifecycle impact data
Defend assumptions in workshops
Explain score changes in real time
Produce audit-ready reports
Existing tools surfaced aggregate scores but failed at interpretation.
The risk wasn’t incorrect calculation.
It was loss of trust.
Core Problem
Teams consistently struggled to answer:
Where did this number come from?
Which lifecycle stage is driving impact?
Which assumptions are responsible?
What changed since the last iteration?
Without structured traceability, workshops slowed down and experts became bottlenecks.
The following decisions were shaped directly by insights from the Vreugdenhil workshops and the constraints of real-world LCA workflows.
APPROACH & KEY DECISIONS
How I translated research into a workflow and system that experts could trust & explain
I led the discovery and synthesis myself. I planned and facilitated UX workshops with sustainability teams, engineers, and LCA experts, and used the outputs to define the workflow, data structure, and interaction model.
Rather than starting with screens, I focused on understanding:
How data moves through the organisation
Where errors, delays, and misunderstandings occur
What information experts rely on when defending results
This allowed me to design a workflow that matched how the work actually happens, not how tools usually present LCA data.
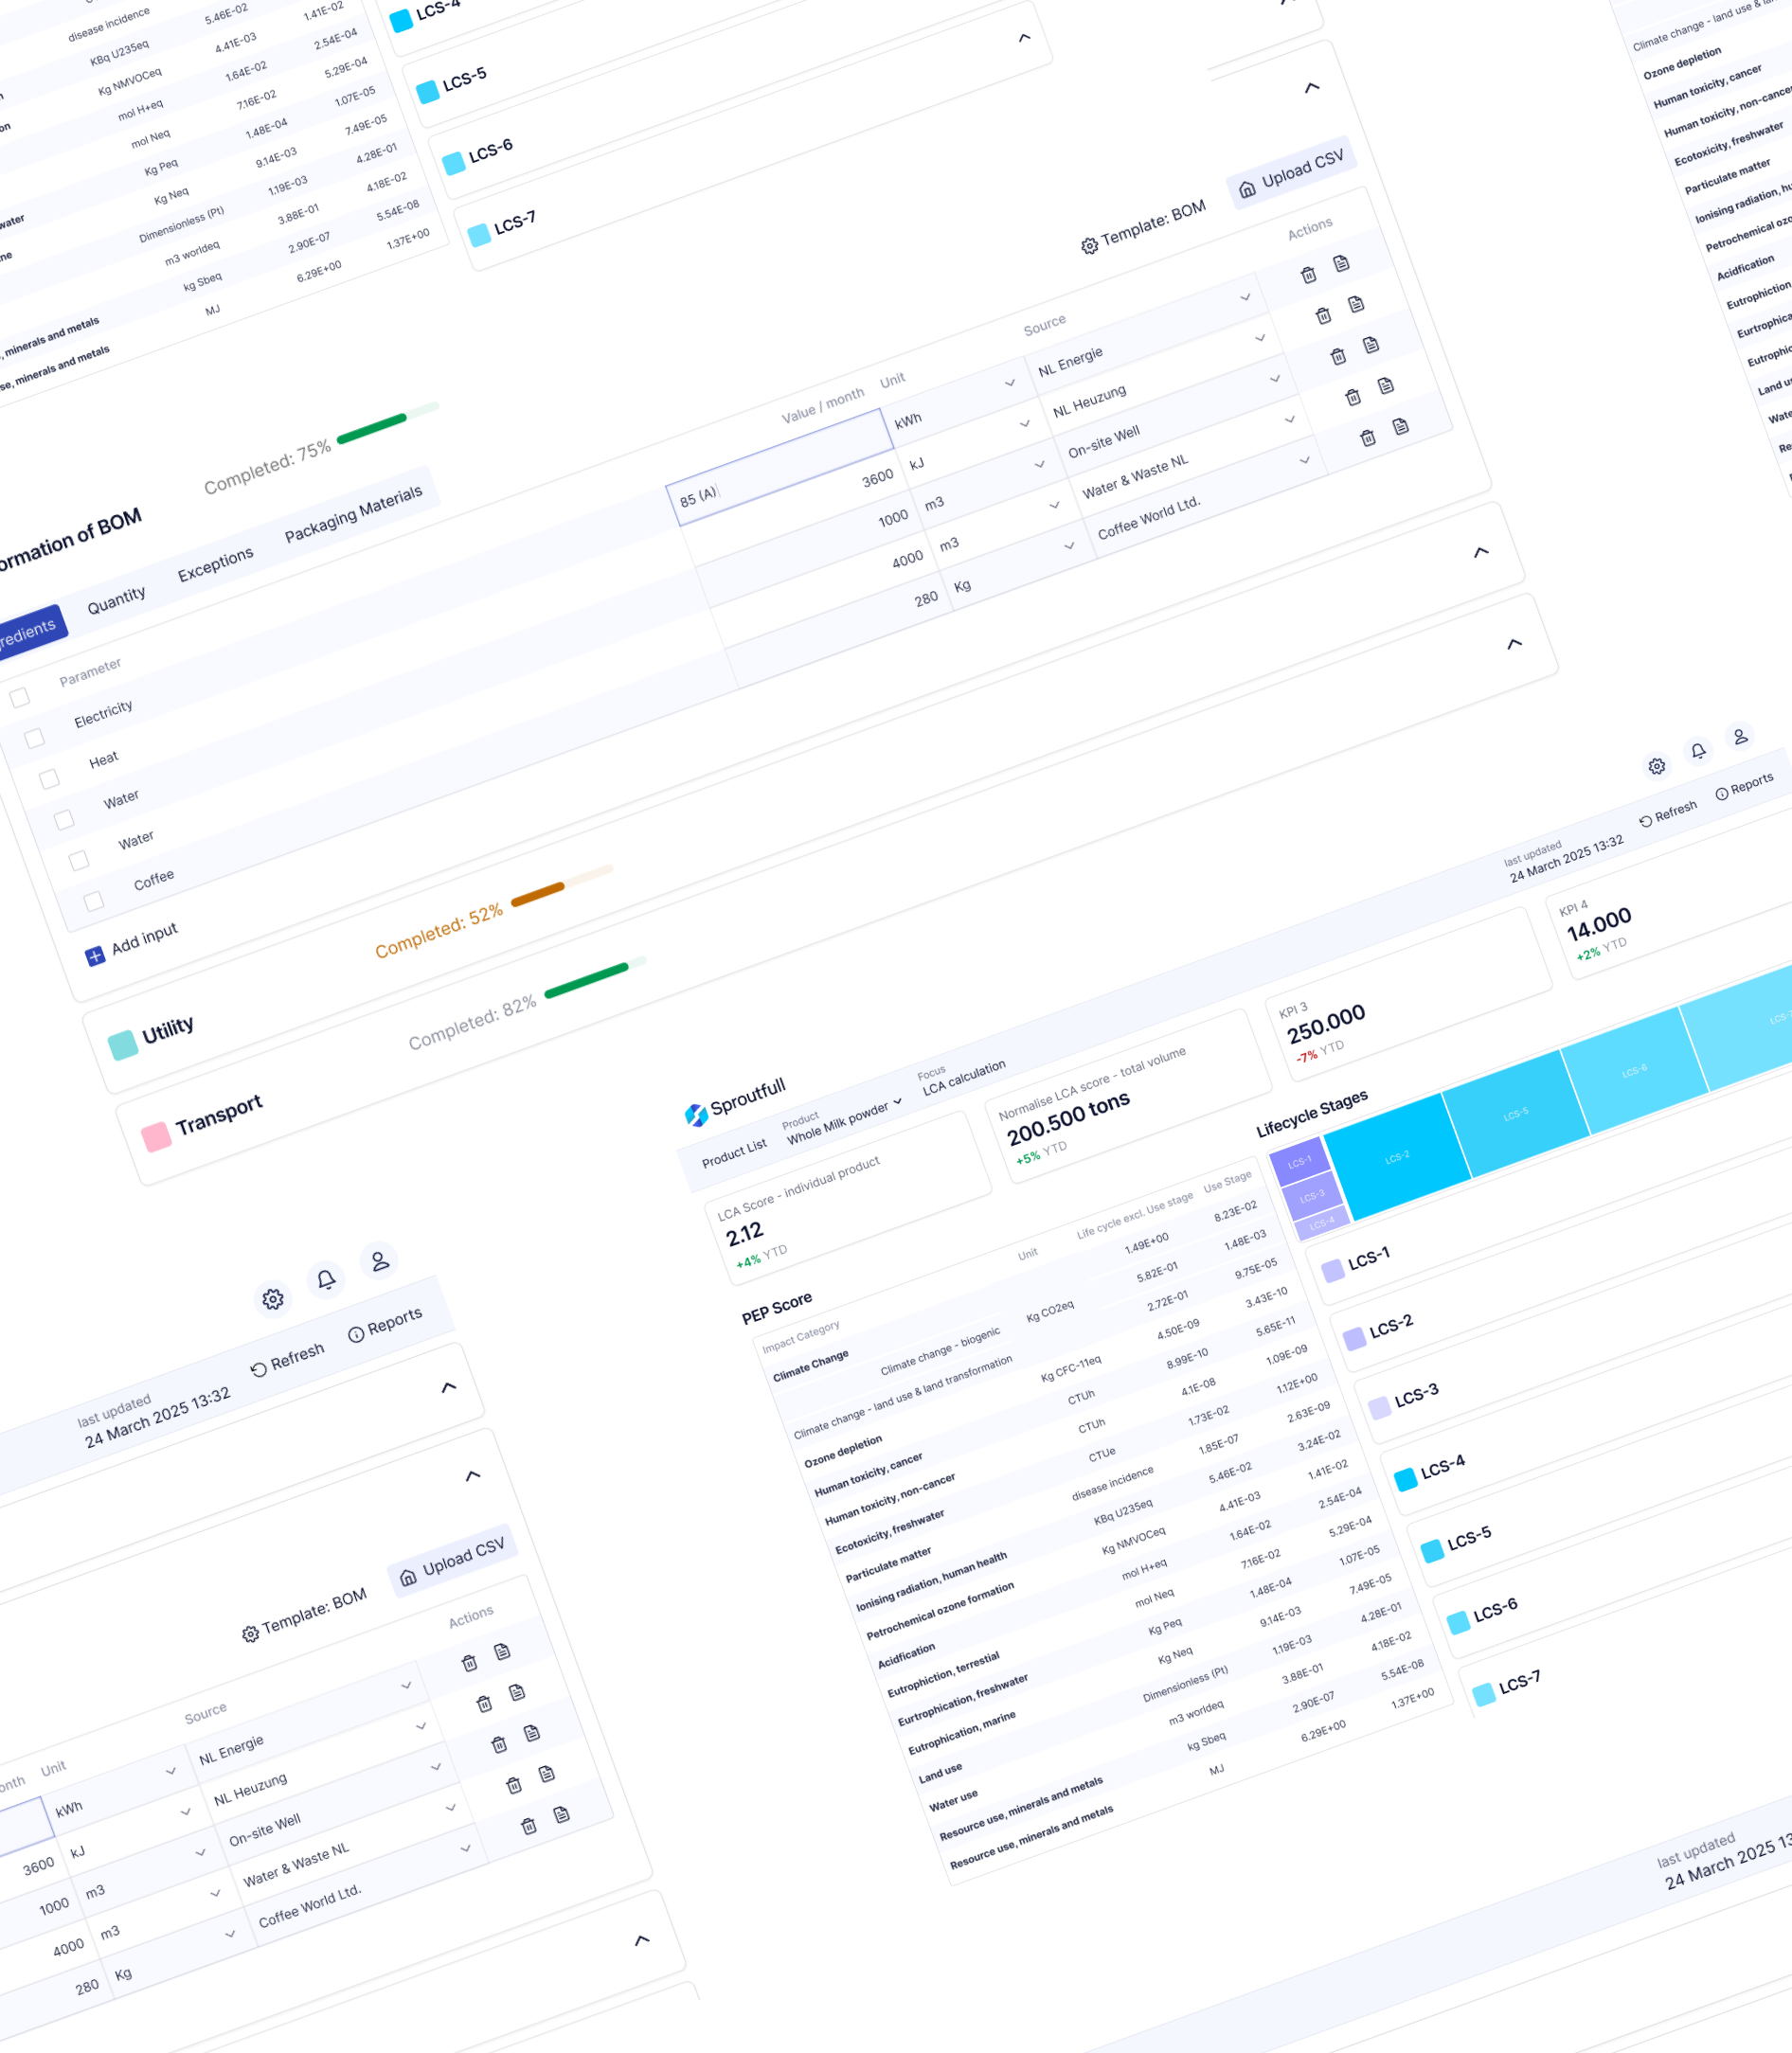
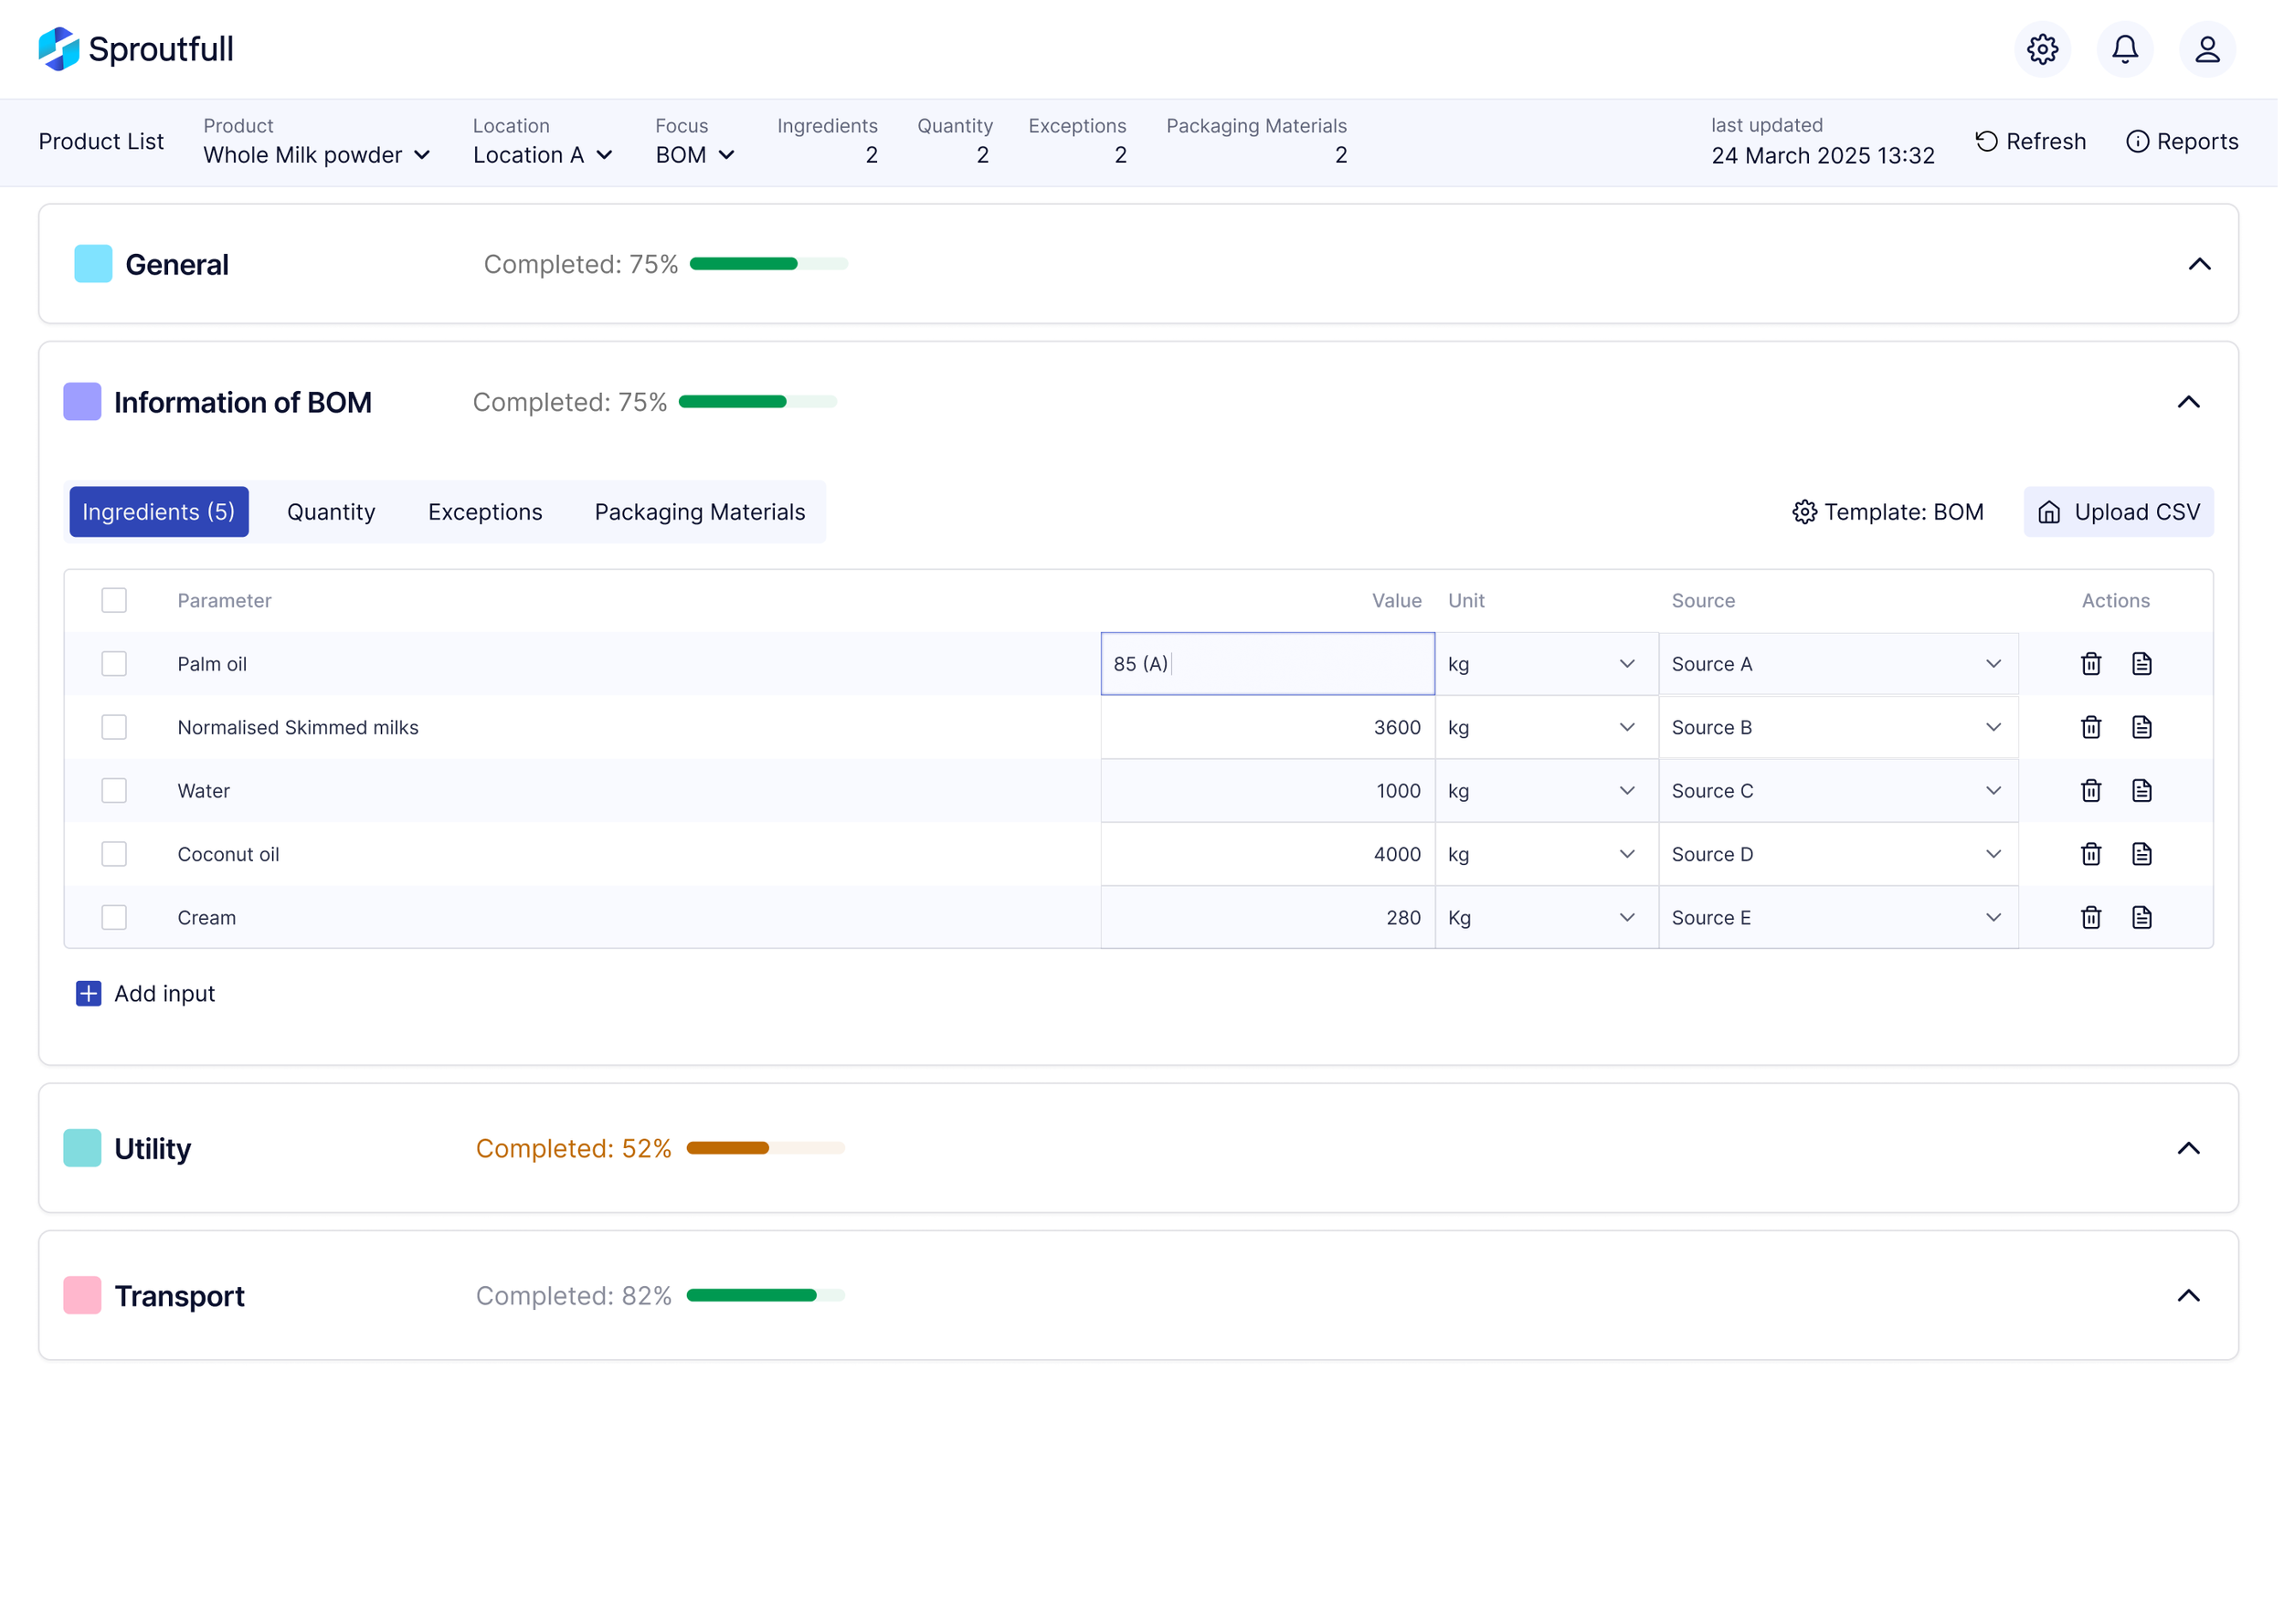
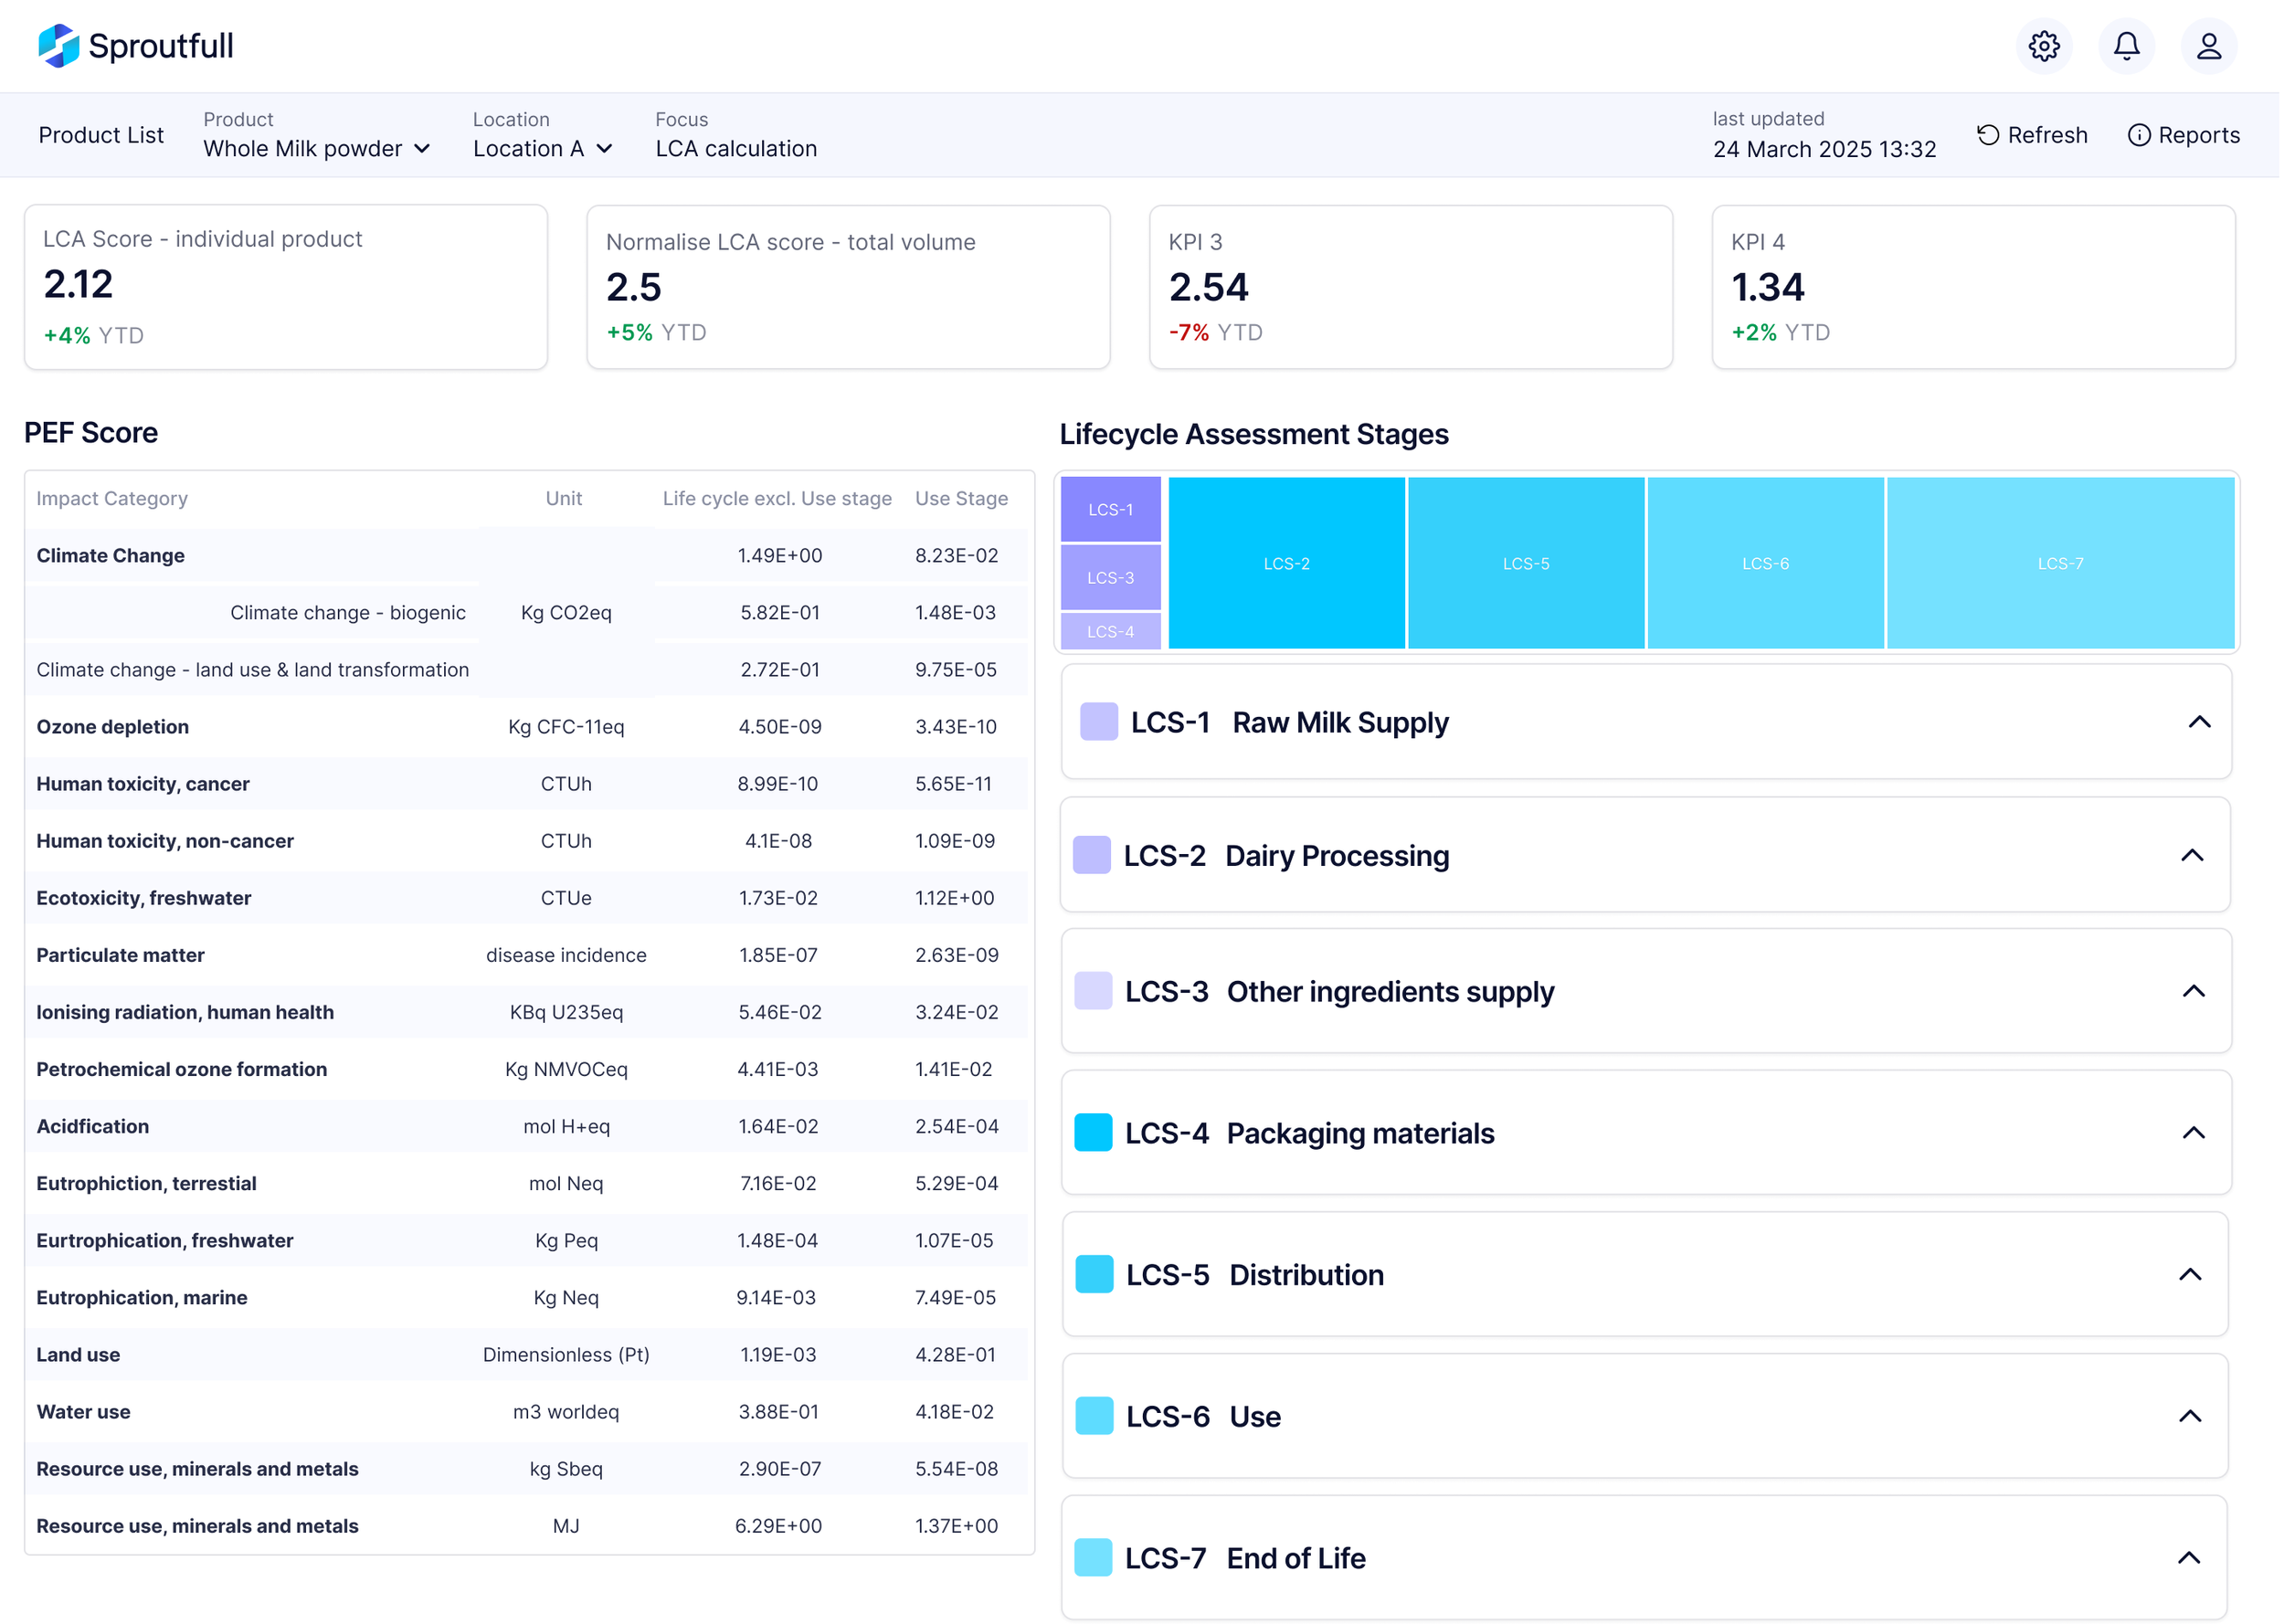
Lifecycle Stages as the Backbone
Instead of centering the experience around a single score, I structured the UI around lifecycle stages.
This mirrored how sustainability teams naturally reason about impact during workshops.
Trade-off:
Increased UI density, but improved interpretability.
2. Assumptions Visible by Default
Assumptions and emission factors remained inspectable.
Hiding them behind advanced views undermined trust during live sessions.
3. Design for live workshops, not just individual analysis
The interface had to:
Support real-time hotspot identification
Avoid export cycles
Allow drill-down without losing context
This shaped interaction latency and disclosure strategy.
4. Progressive Disclosure Instead of Dual Modes
Rather than separate “expert” and “simplified” versions, I used composable components to support layered inspection within one flow.
This prevented fragmentation and preserved data consistency.
IMPLEMENTATION AND SYSTEM DESIGN
Design decisions encoded in the system, not documentation
I implemented the core product-level LCA experience using Next.js and TypeScript, working directly against live data. The focus was on encoding lifecycle stages and traceability into the system so design decisions scaled as the product evolved.
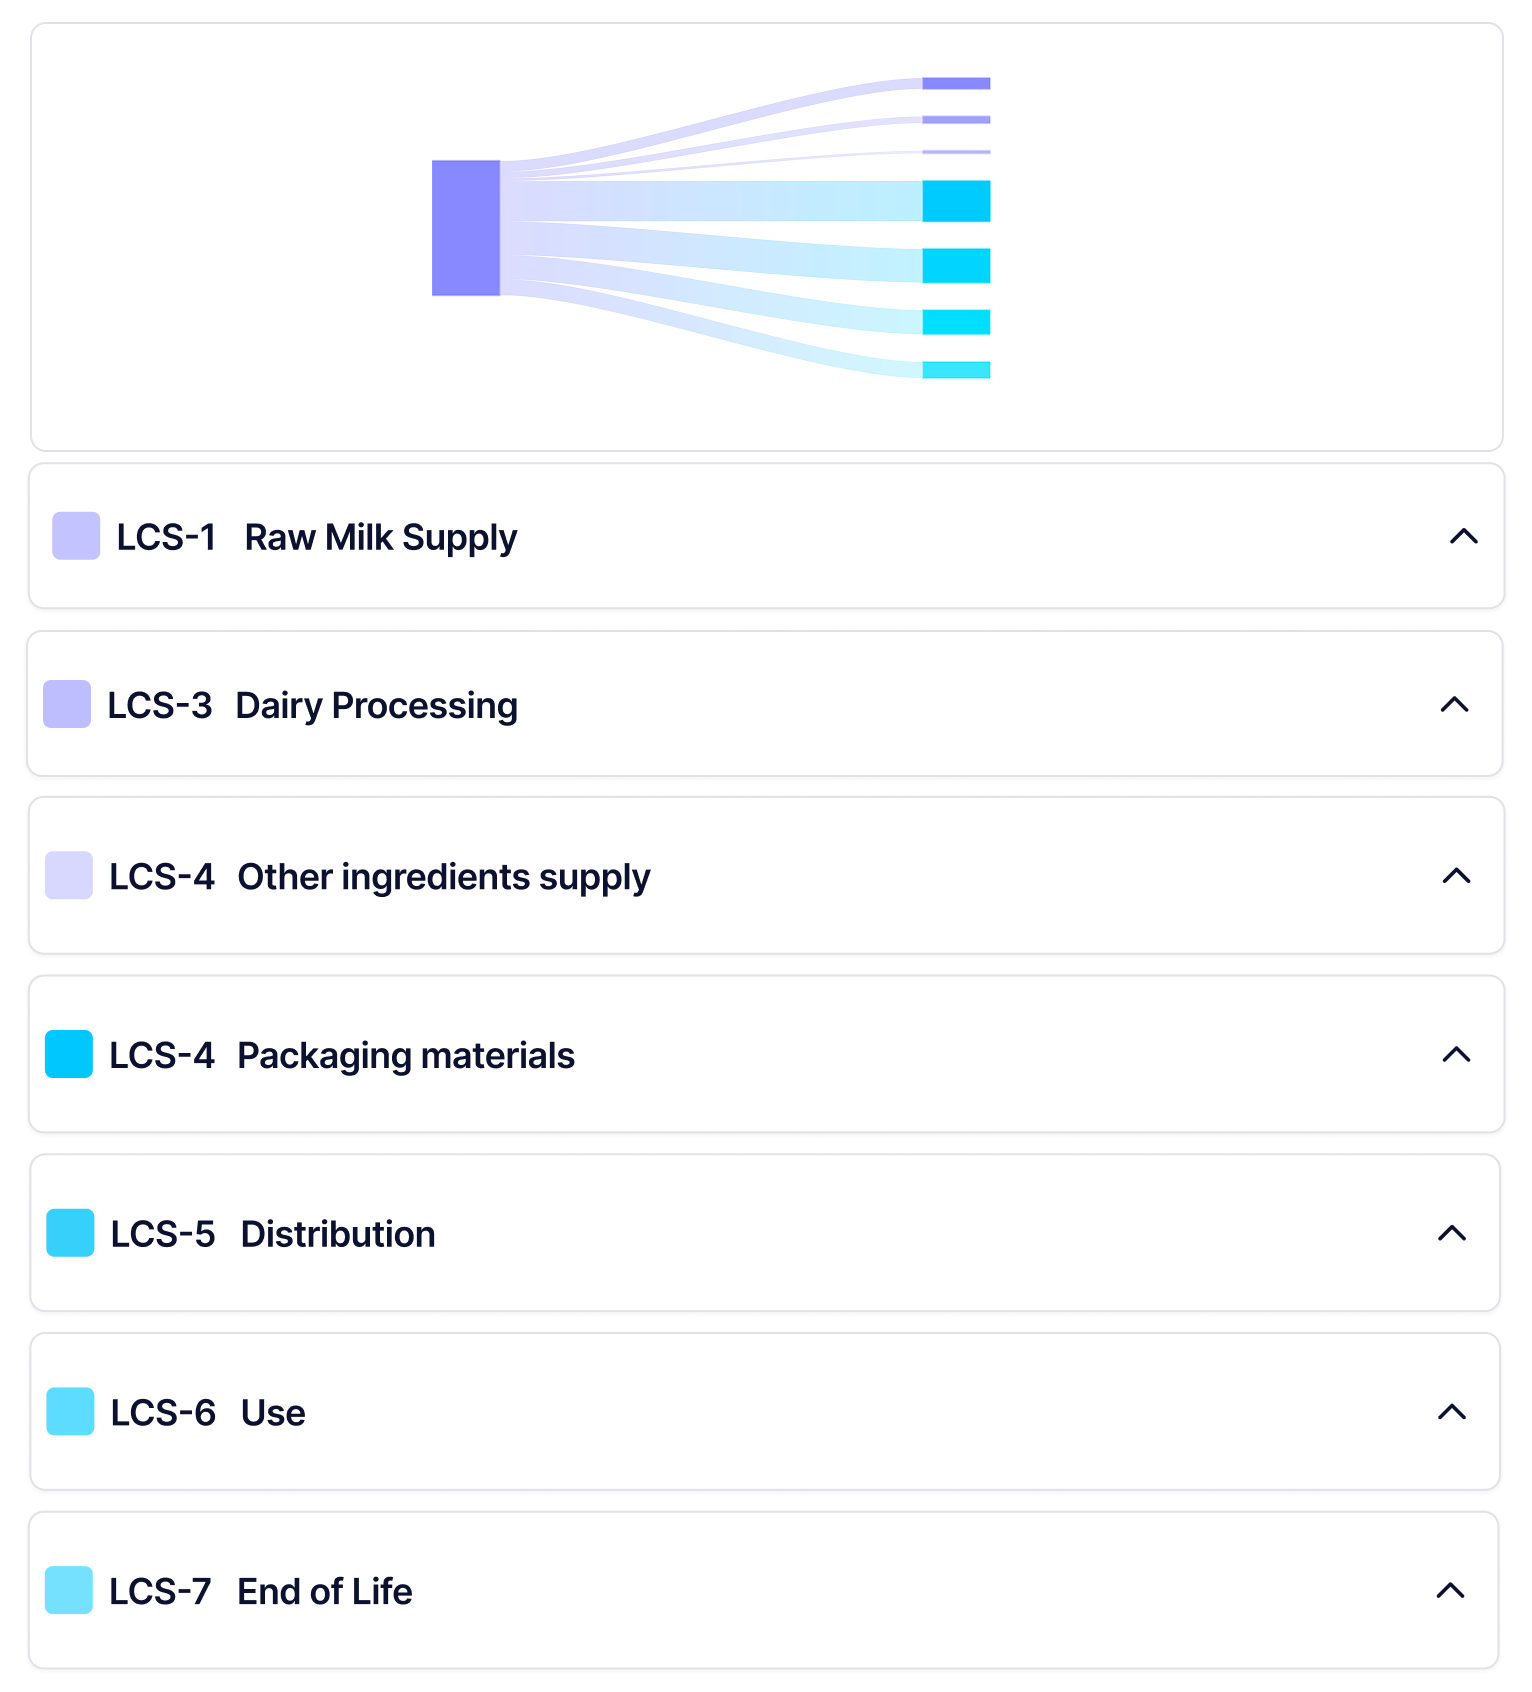
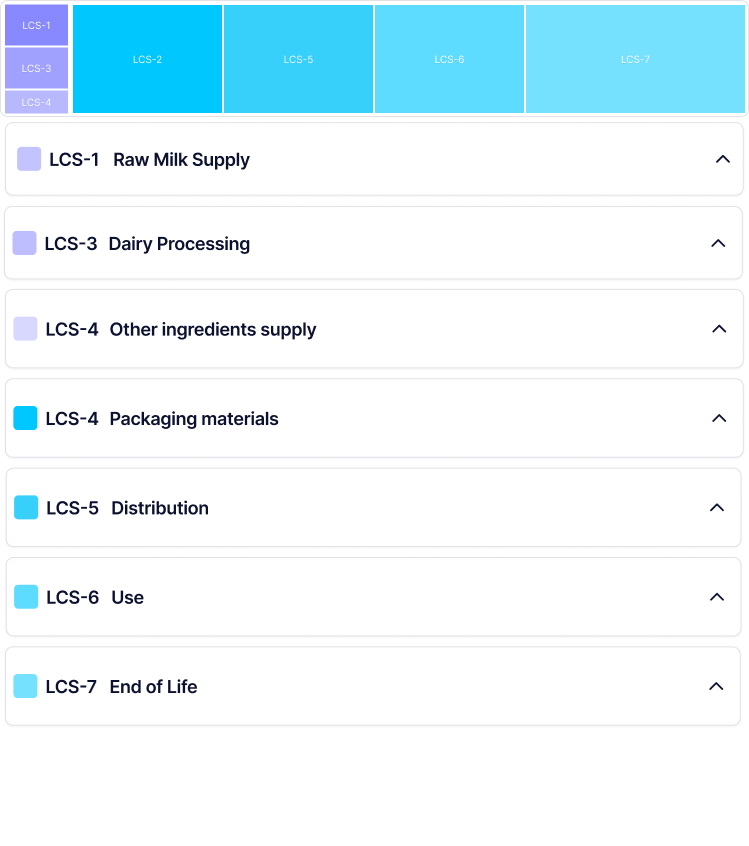
Lifecycle-stage data rendered through shared components, enabling high-level scanning and detailed inspection without branching the UI.
Lifecycle stages were modelled as first-class concepts in both the UI and component architecture.
The same data contracts powered tables, summaries, and visualisations, ensuring consistency, traceability, and predictable behaviour as inputs changed.
Progressive disclosure through component composition
Instead of separating “expert” and “simplified” views, I used composable React components to support progressive disclosure within a single flow.
Users could:
Scan results quickly at a high level
Drill into contributors and inputs when questions arose
Stay in context during live workshops and reviews
This avoided parallel interfaces while still supporting very different levels of expertise.
Validating visual representations before committing to production
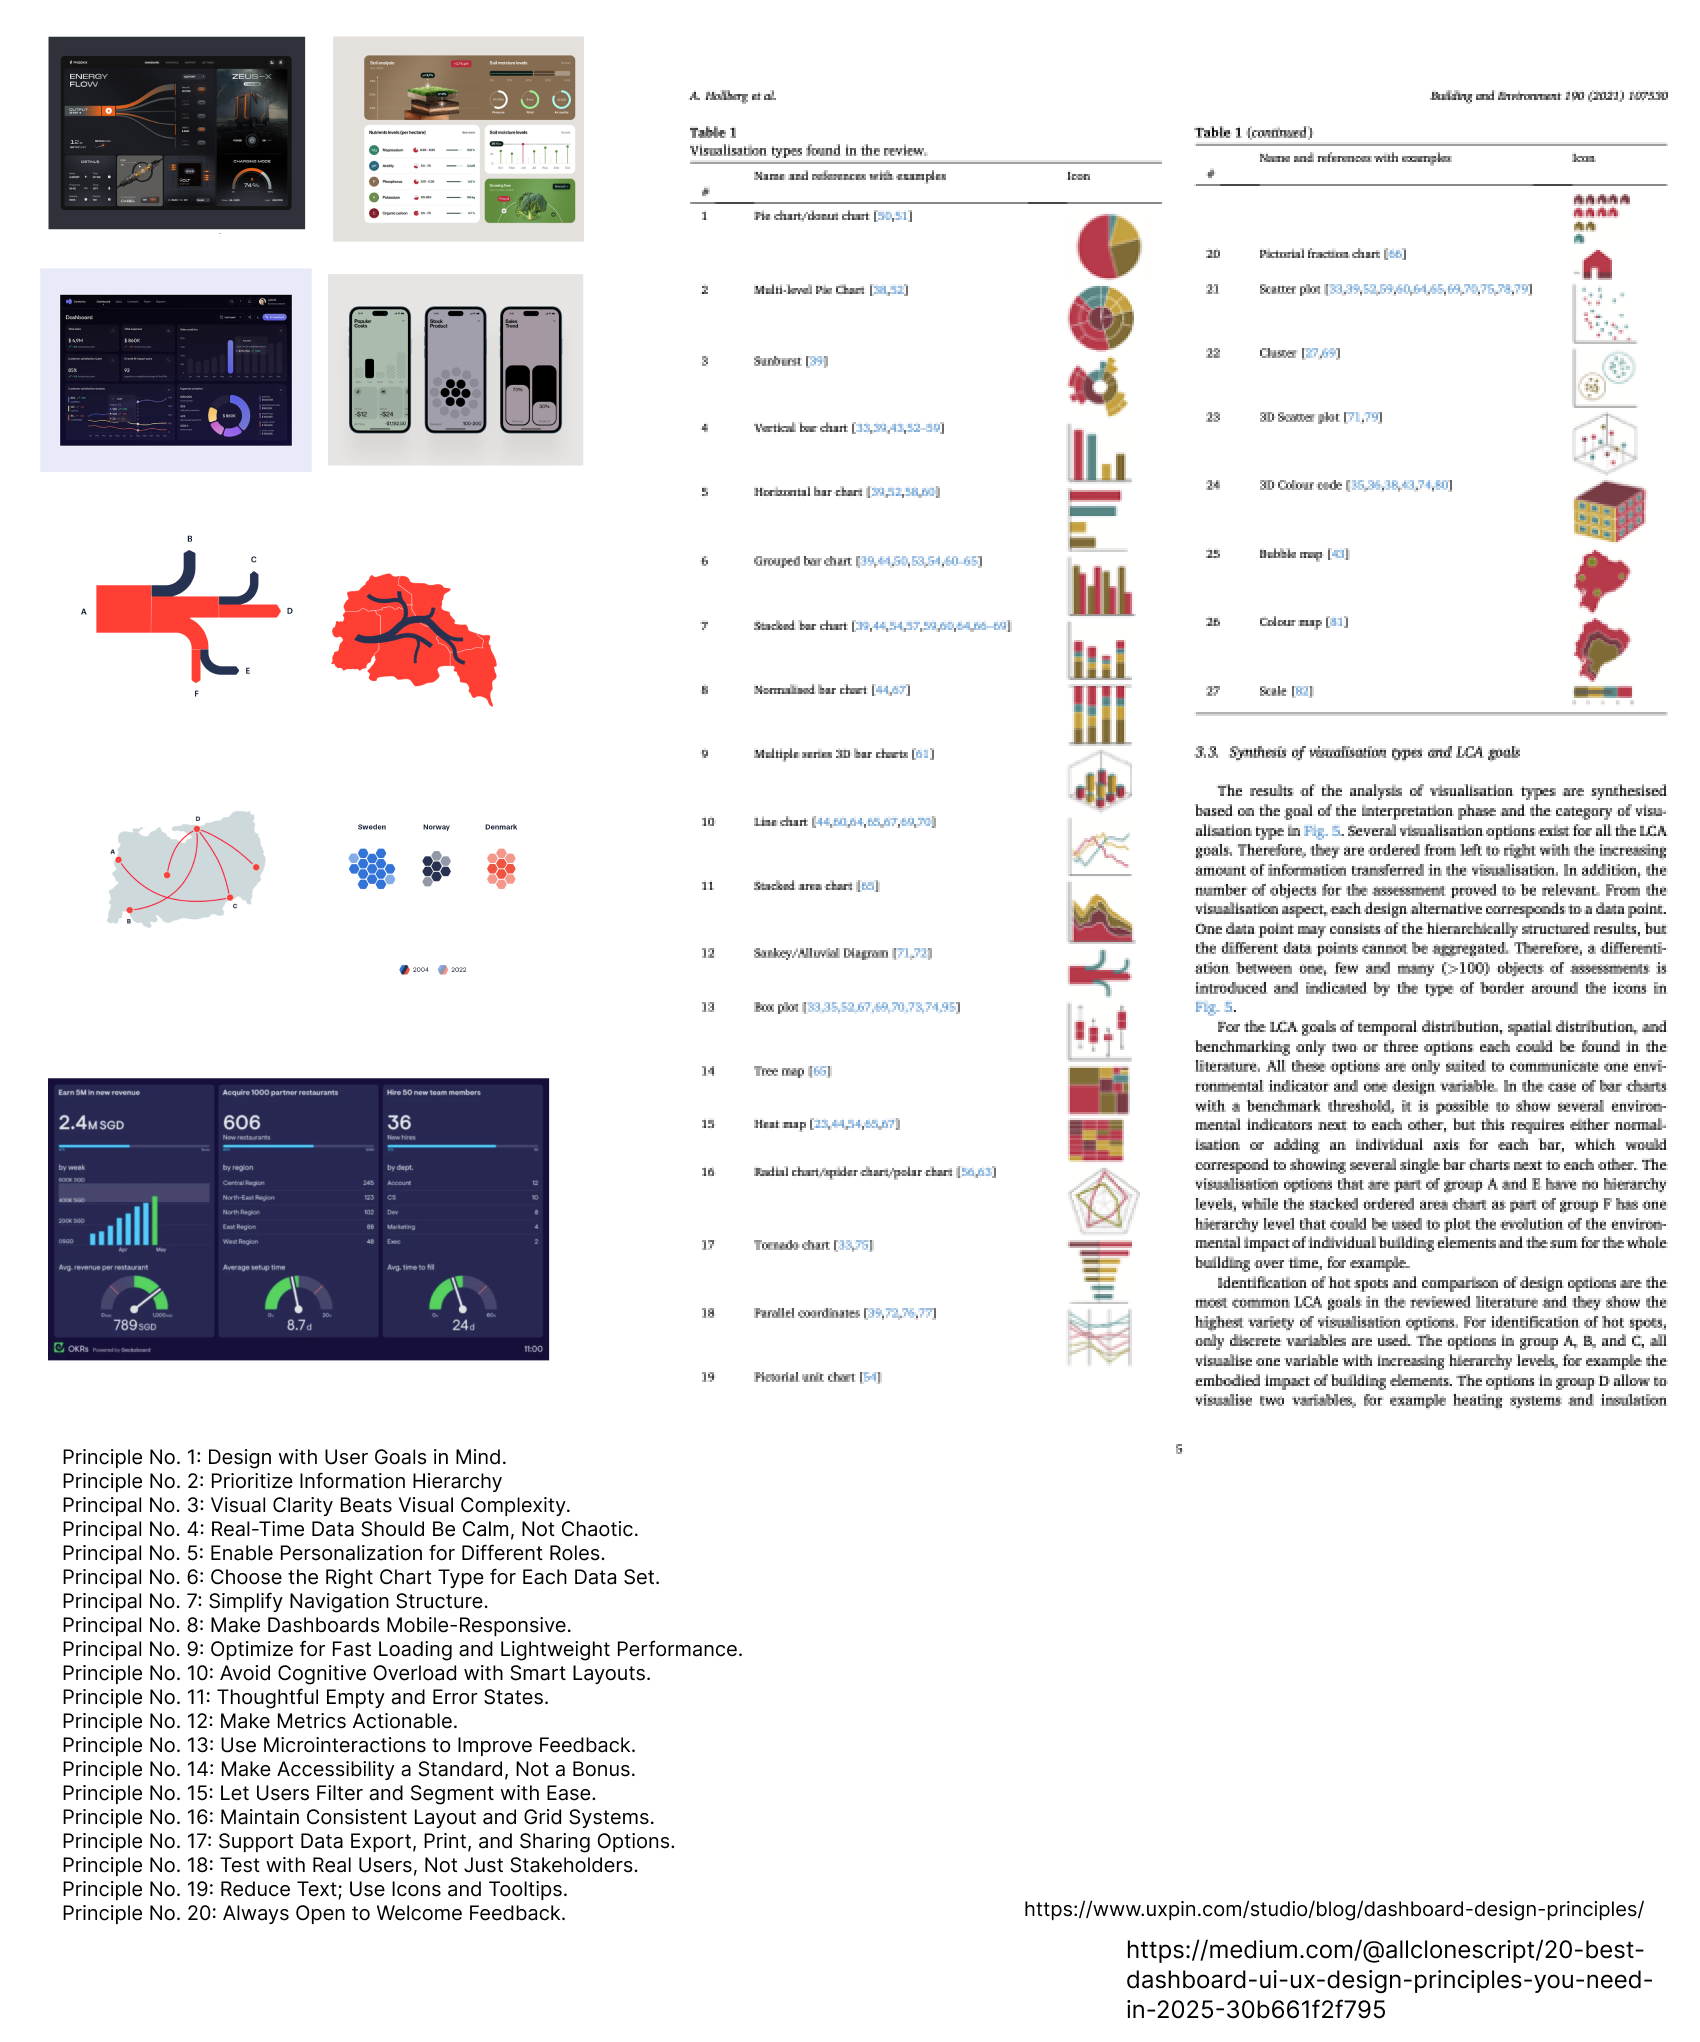
Exploration of visual representations to balance explainability, traceability, and performance before committing to production components.
Before locking in production components, I explored multiple visual representations to understand how different patterns supported explanation and comparison. These explorations focused on how quickly users could identify hotspots and explain results under time pressure.
The final implementation prioritised clarity and traceability over novelty, ensuring visuals could be defended in stakeholder and client discussions.
Designing for change, not just delivery
Rather than treating this as a single feature, I designed the system for extension:
Lifecycle stages could be added or refined without redesigning the UI
Visualisations shared common data contracts
Components were reused across analysis views and reporting outputs
Design decisions lived in code, not documentation
This reduced maintenance overhead and prevented UI drift as the product evolved.
After shipping
As teams adopted the workflow, feedback shifted from “how do I calculate this?” to “what should we do next?”, signalling that the system removed friction instead of adding it.
OUTCOMES, IMPACT & WHAT I’D DO NEXT
The workflow was validated through UX workshops and follow-up sessions with Vreugdenhil’s sustainability team, engineers, and LCA specialists using real data and real reporting constraints.
Feedback consistently focused on increased confidence, faster explanation, and reduced dependence on expert mediation during reviews and workshops.
Adoption & impact: a scalable tool that works
What changed in practice
Discussions shifted from “do we trust this number?” to “what should we change to improve it?”.
Knowledge became shareable rather than siloed with experts, workshops became decision-focused instead of explanatory, and reporting flowed naturally from analysis instead of requiring separate manual work.
Quantitative impact
Reduced LCA interpretation workflows from 20+ manual steps to ~6 structured steps
Cut time spent explaining results in workshops from hours to minutes
Enabled teams to identify lifecycle hotspots immediately, without exporting data to spreadsheets
Reduced reliance on LCA experts during stakeholder discussions by making assumptions and contributors visible in the product
What this unlocked
By moving LCA work out of fragmented spreadsheets and into a structured system:
Knowledge became shareable, not siloed with experts
Workshops became decision-focused instead of explanatory
Reporting felt like a continuation of analysis, not a separate task
This created a stronger foundation for scaling LCA work across products and teams.
What I’d do next
Scenario comparison at scale
Make it easier to compare multiple scenarios side by side to support trade-off discussions during decision-making.
Stronger reporting integration
Tighten the connection between analysis views and generated reports so insights flow directly into external communication.
Governance and validation tooling
Add clearer signals around data completeness, assumptions, and validation status to support audit readiness.
Performance optimisation for larger datasets
As datasets grow, invest further in performance and loading strategies without sacrificing explainability.
Each of these builds on the same system foundations rather than introducing parallel workflows.
Why this matters
This project reinforced my belief that strong UX in complex systems comes from encoding real workflows and constraints directly into the product.
The goal wasn’t to simplify LCA work, but to make its complexity inspectable, defensible, and usable by the people who depend on it.