Turning environmental reporting into a decision-support tool
Role: UX Engineer/Product Designer
Scope: Research, product design, usability testing, front-end development
Product: B2B environmental footprinting platform
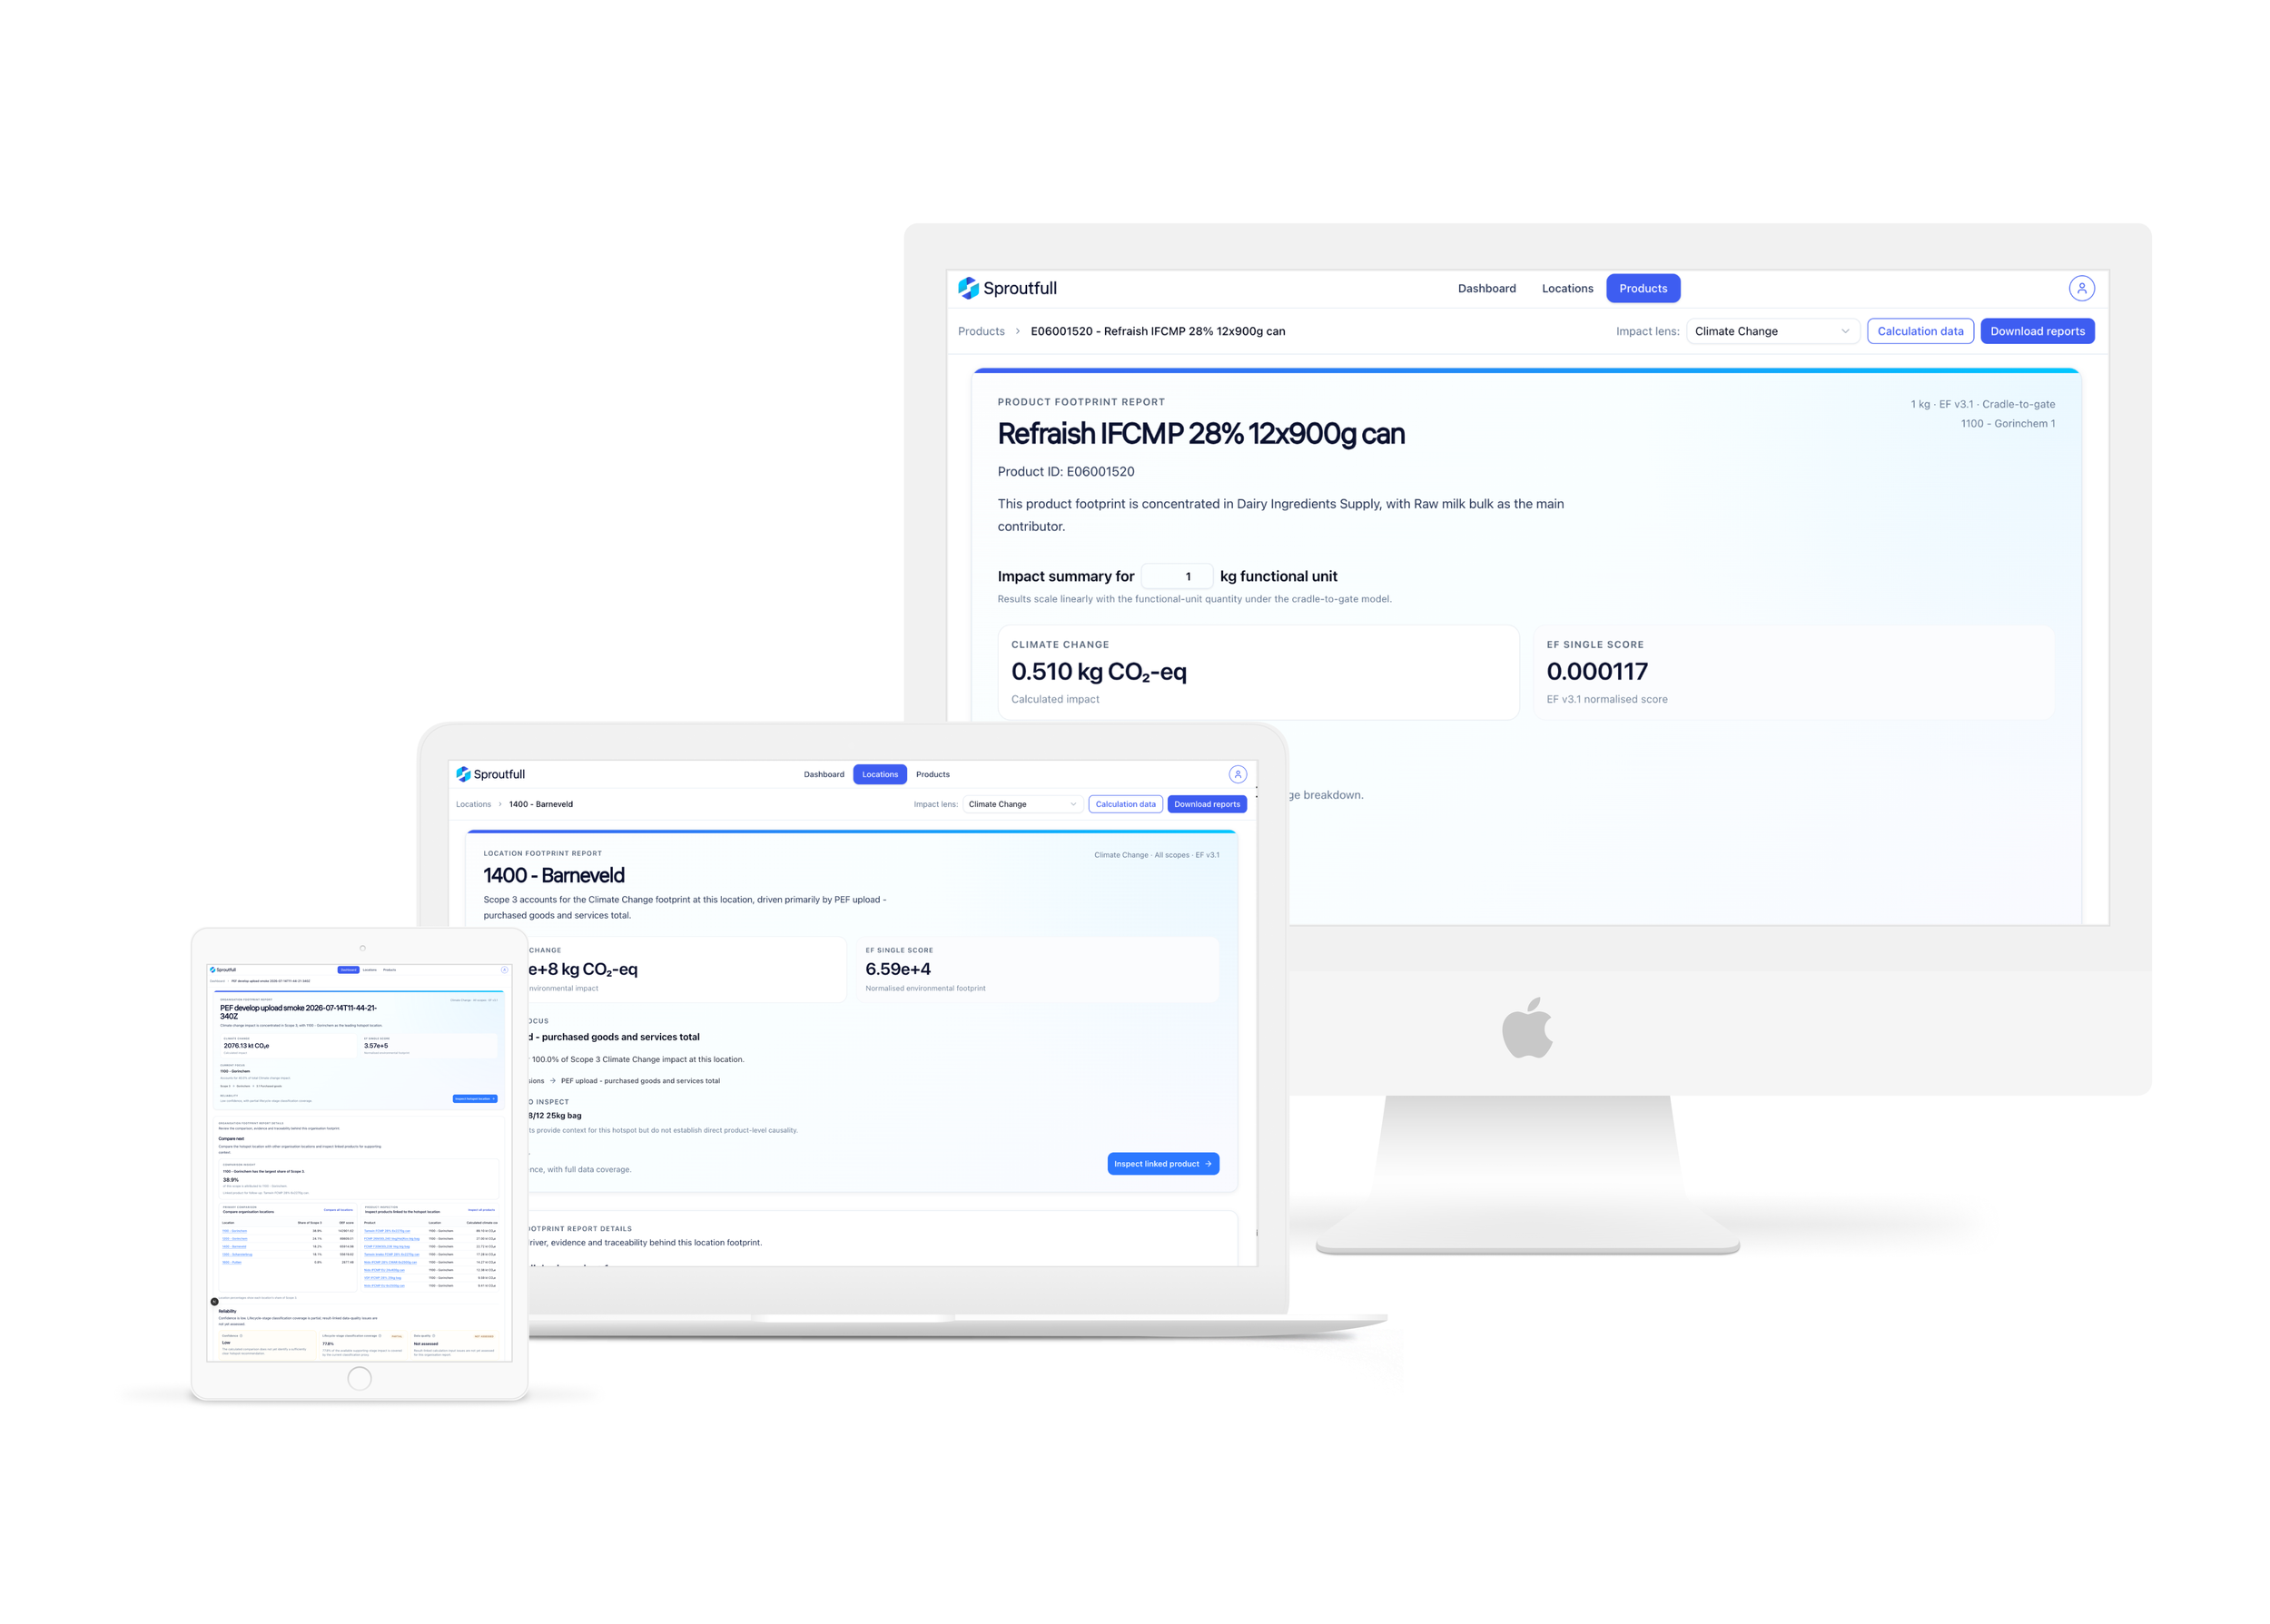
Sproutfull began as a tool for calculating environmental footprints. After the first MVP, stakeholder feedback exposed a bigger problem: producing the number was only useful if people could understand what was driving it and decide what to do next.
I helped turn that insight into a new product direction, working across research, product design and front-end development to evolve Sproutfull into a decision-support tool.
Calculate → Understand → Trust → Investigate → Decide
02 - THE ORIGINAL PROBLEM
We started with a calculation problem
Environmental footprinting was a slow, specialist process.
The sustainability team worked across spreadsheets, exports and inconsistent source data. Producing a product footprint could involve more than 20 manual steps, repeated clarification, and a lot of preparation before anyone could begin interpreting the result.
Our first MVP had a clear job:
Make environmental calculations faster, structured and repeatable.
Working with sustainability specialists, we mapped the existing journey from data intake and clarification through calculation, validation and reporting.
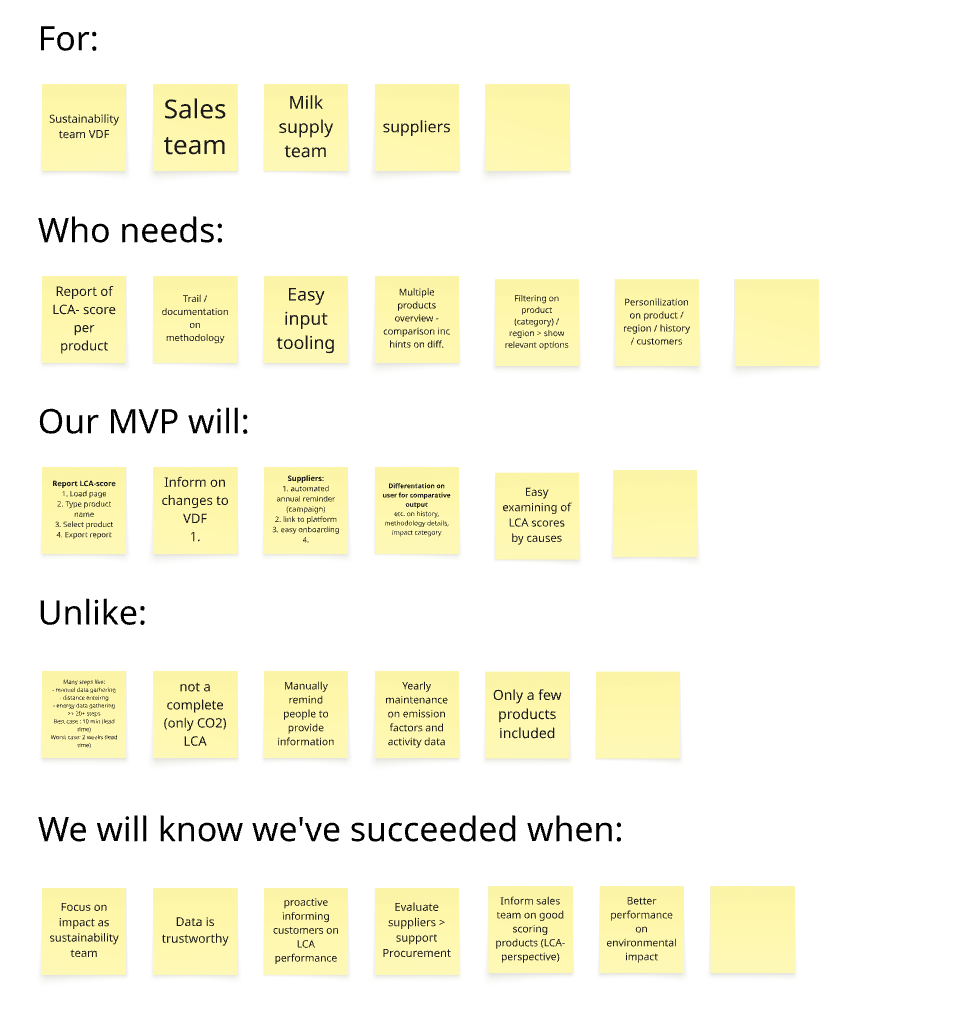
That gave us an initial product target:

make results easier to reproduce;

reduce a 20+ step process to around six structured actions;

preserve the source and context behind the calculation;

reduce the amount of manual work needed to reach a usable footprint.
We shipped the first slice as a working calculation experience, giving stakeholders a structured way to reach and review the footprint inside the product.
The first MVP was about getting users to the number.
03 - THE PIVOT
Then the problem changed
Once stakeholders could see the first working calculation experience, the conversation shifted.
Two comments stayed with me:
“It would be interesting to see what we could do with this number.”
“How will this report influence the way we go?”
These were informal conversations, but they exposed a bigger product question:
“What can we do with this?”
The first MVP was doing what we had designed it to do.
What I heard next was a different problem.
The result still left people to work out what mattered, what was driving it, how much confidence to place in it, and where they should look next.
I wasn’t given a new brief to solve that problem.
I treated the feedback as a product signal, went back to the earlier research, and looked again at the wider jobs people were trying to do around environmental data: compare results, understand where impact was concentrated, explain the drivers to other teams, and decide where to focus.
The signals had been there from the start. Shipping the first MVP made the gap much easier to see.
So I took a new hypothesis back to the team:
The footprint should not be the end of the experience.
It should be the start of an investigation.
That became the pivot from calculation towards decision support.
04 - DOMAIN LEARNING
Learning the domain and finding the bigger need
I was also working in a domain I did not know deeply when I joined the project.
To design the next step well, I needed to understand how sustainability teams reasoned about environmental data: lifecycle stages, Scope 1, 2 and 3, calculation dependencies, data coverage, source quality, and the limits of what a result could actually support.
I worked closely with sustainability specialists to build that understanding, then translated it into product questions a non-expert could follow.
When I went back to the original research, the broader needs were clear. Users wanted to compare results, understand where impact was concentrated, explain the main drivers to colleagues, and decide where to focus next.
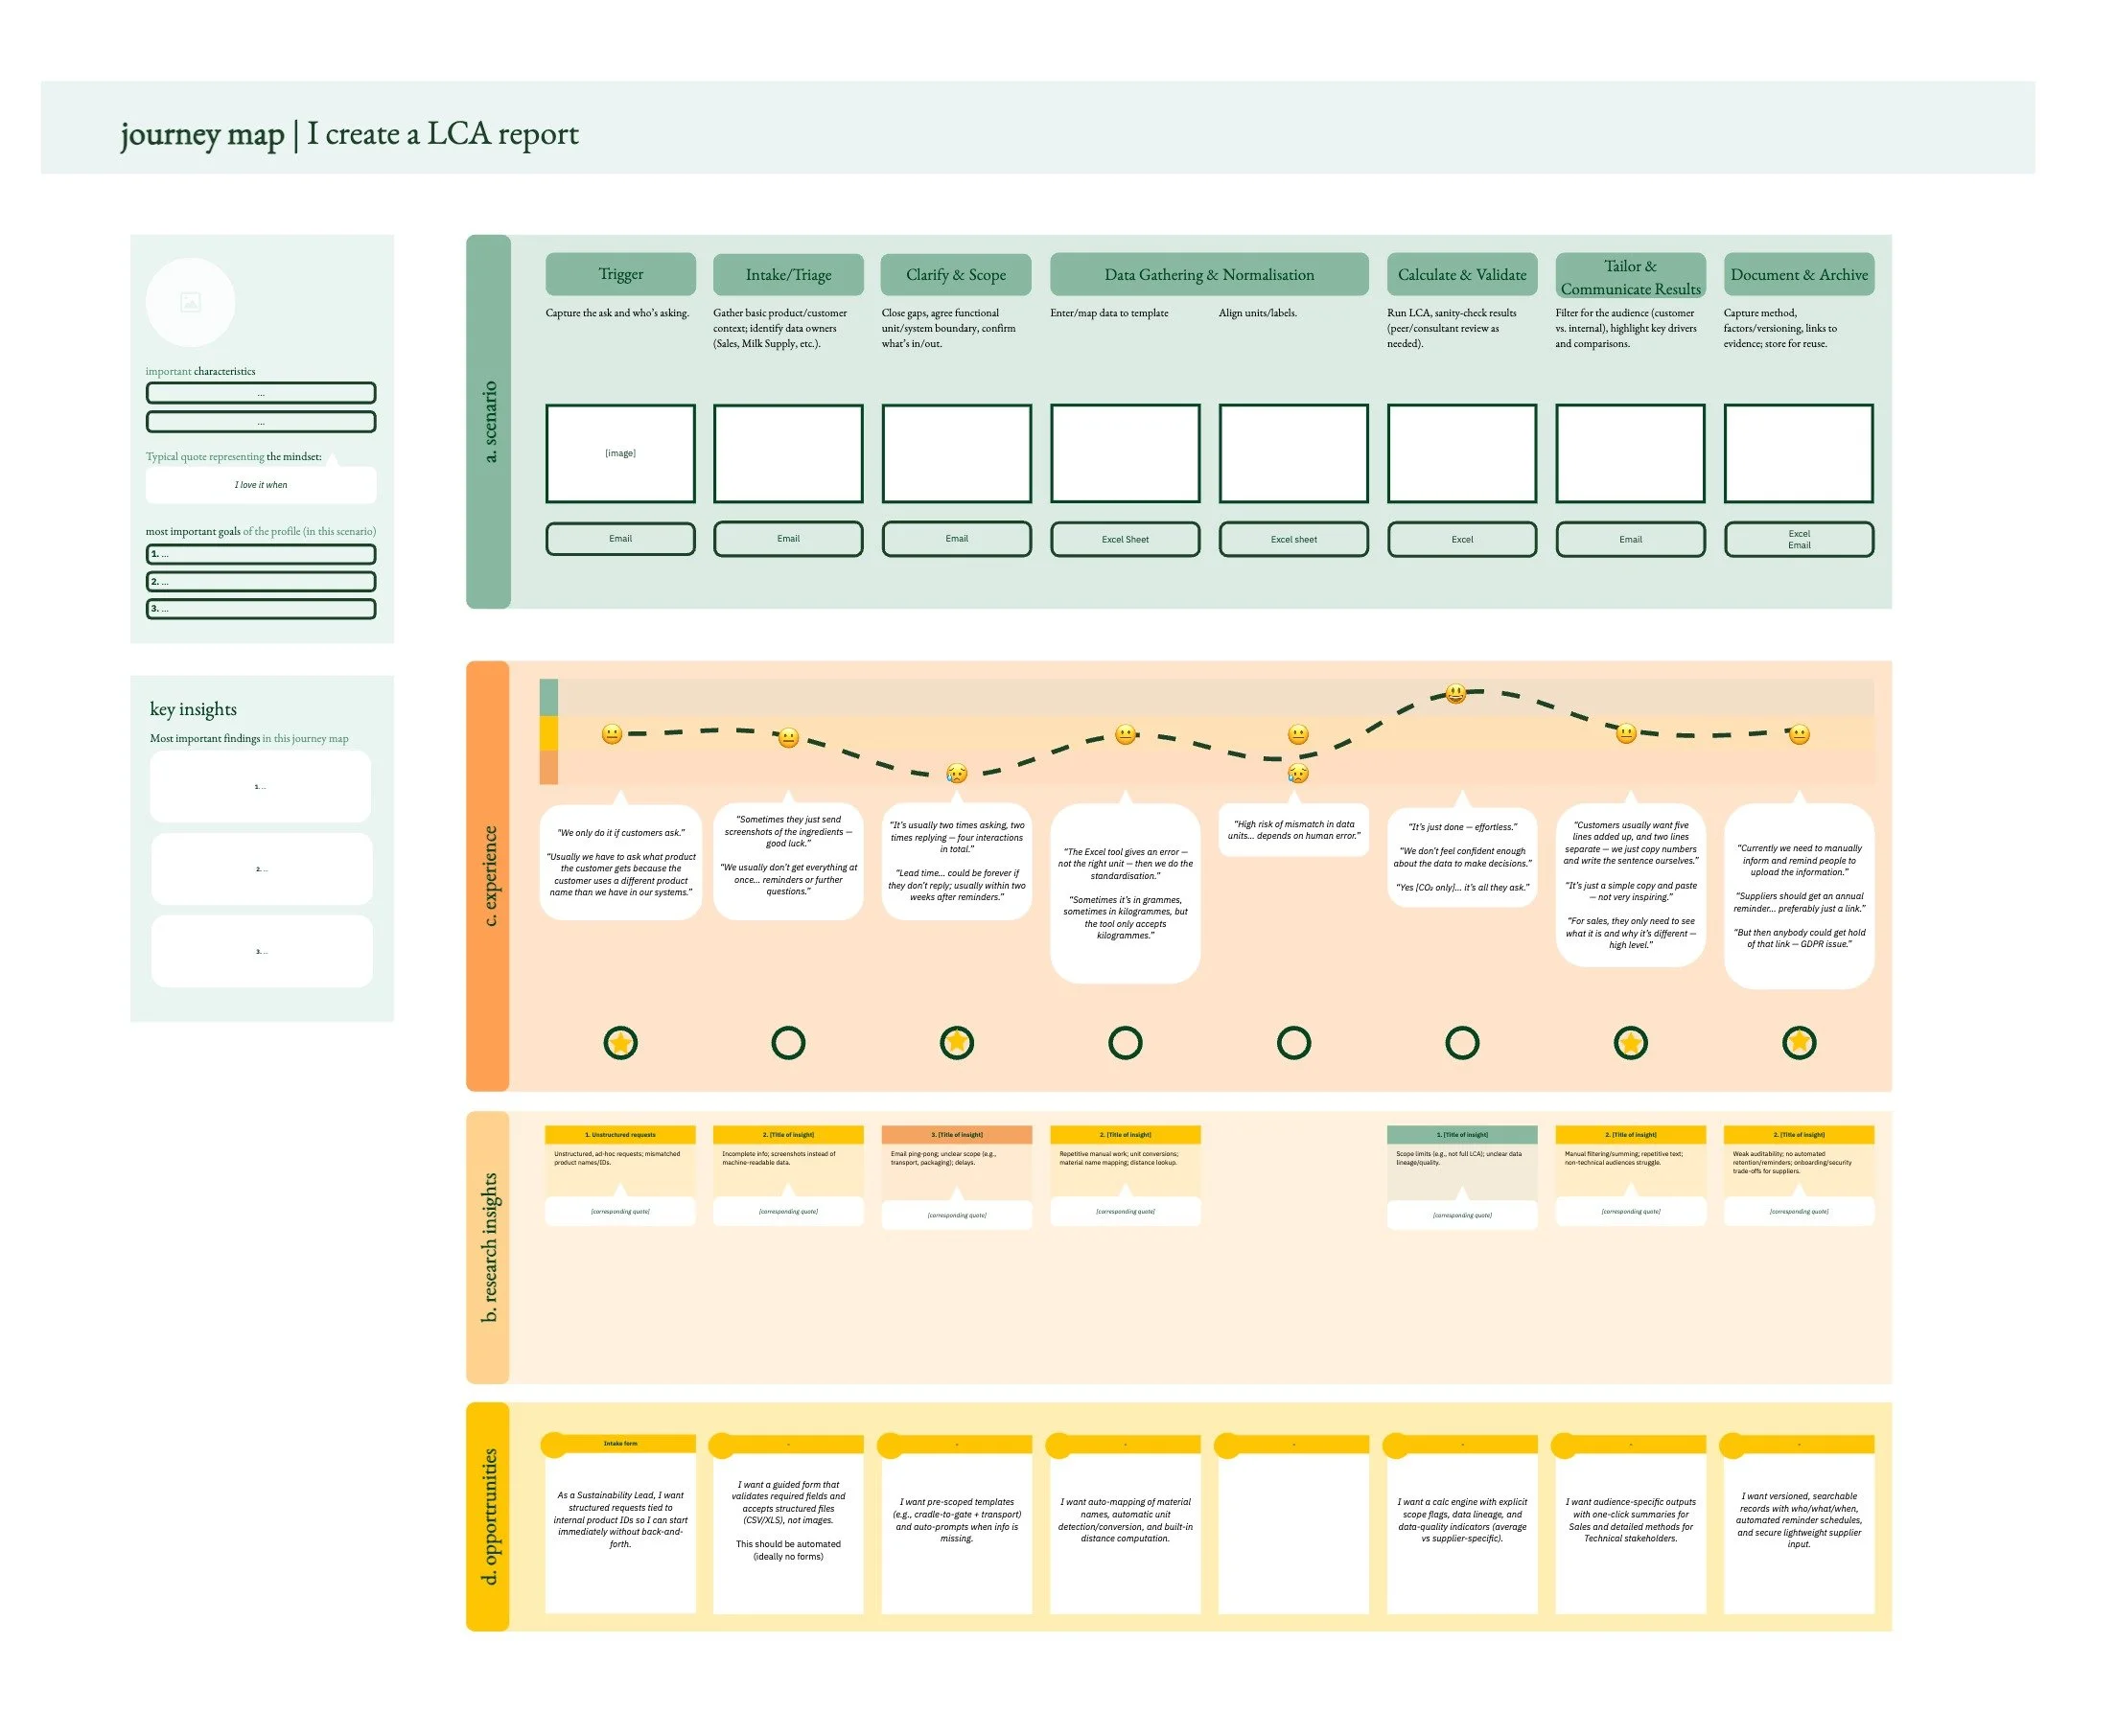
Mapping the existing footprinting journey with sustainability specialists helped me understand both the calculation workflow and the decisions people were trying to make around it.
Different people helped me validate different parts of the problem. Users showed me whether the experience made sense. Sustainability specialists challenged the environmental interpretation. Implementation exposed what the underlying data could actually support.
That helped me turn a broad idea, “what can we do with this number?”, into a clearer product direction.
05 - PRODUCT REFRAMING
From report to decision journey
I stopped thinking about the report as a page of environmental data and started designing around the questions someone would ask before making a judgement.
What is the result?
What is driving it?
How much confidence should I place in it?
Where did it come from?
What should I investigate next?
My first response was to bring more interpretation closer to the result.
Across Organisation, Location and Product, I explored ways to surface hotspots, main contributors, comparisons, priorities and supporting evidence, while still giving users access to the underlying calculation.
There was an important trade-off here.
We could have kept adding more environmental detail to the report, but more information was not necessarily more useful. I prioritised the questions that affected the user's next decision: what matters, how reliable it is, and where to investigate.
Over time, those questions became a clearer reporting structure:
Result → Focus → Reliability → Evidence → Traceability → Detailed inspection
The early versions were an important step forward, but they also exposed a new problem.
We had added more guidance, but we had also added more information.
Environmental data was never going to become simple. The design challenge was to reveal the complexity in the order someone needed it.
That became the focus of usability testing.
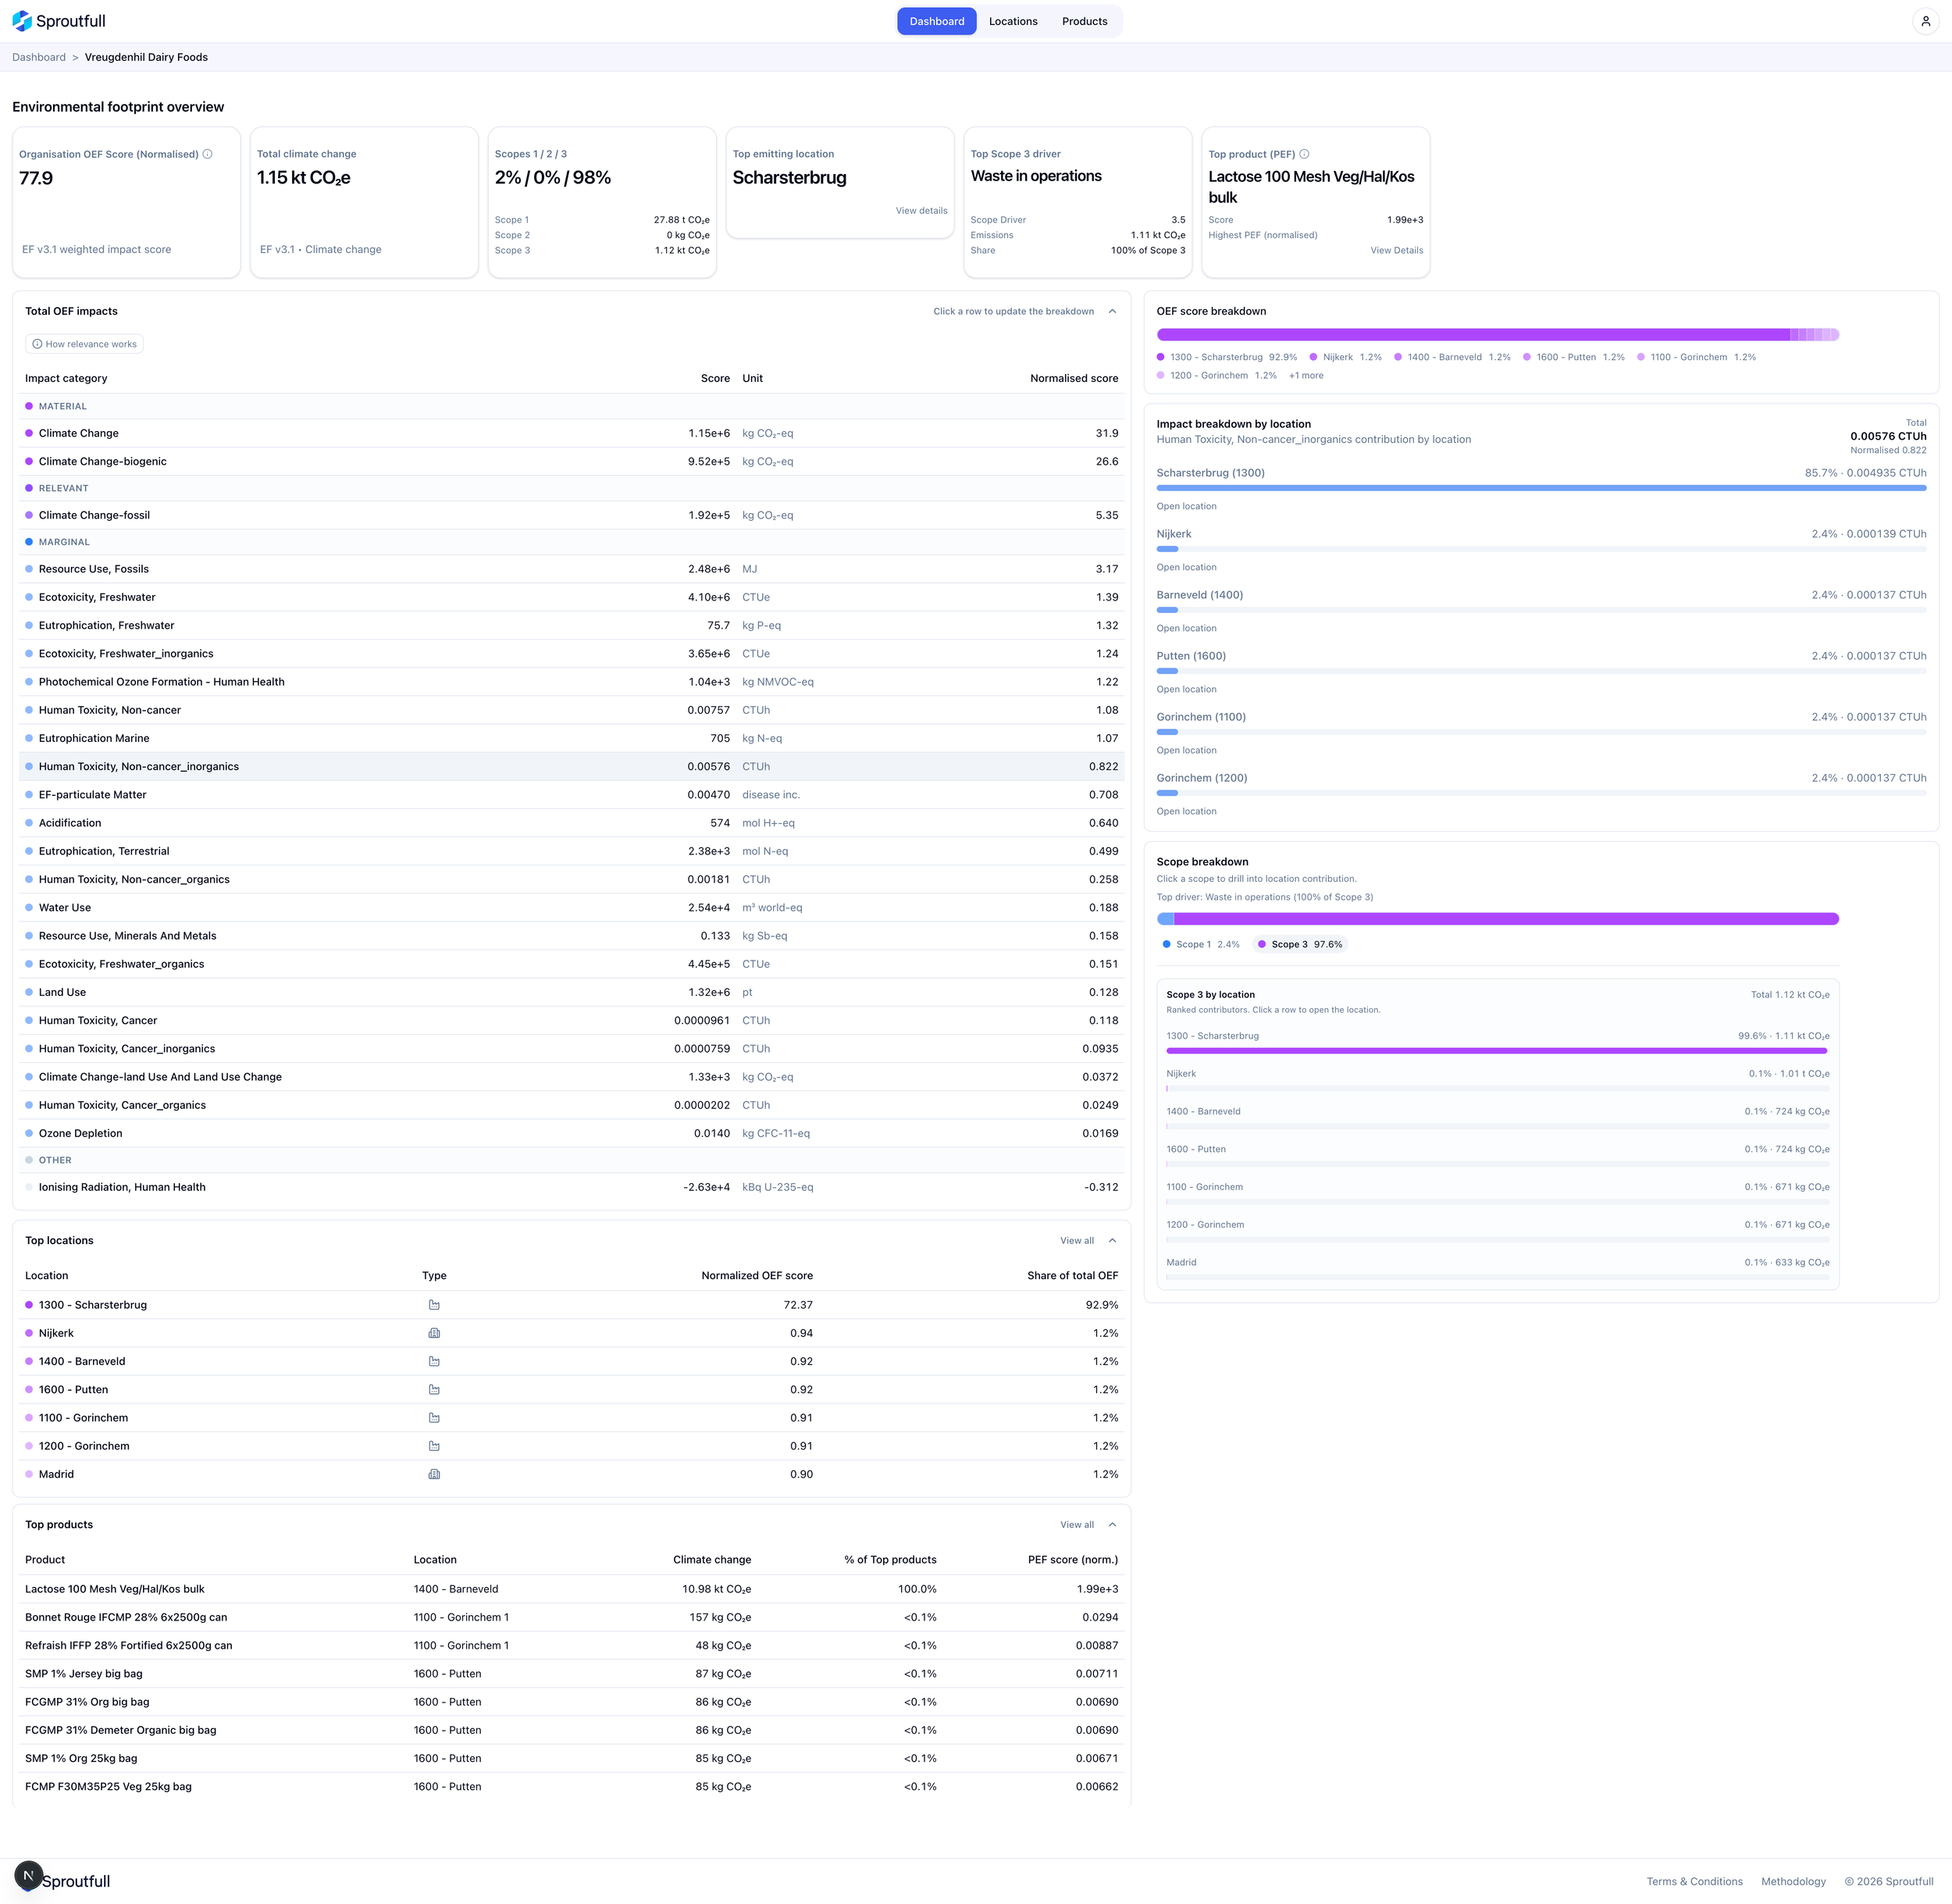
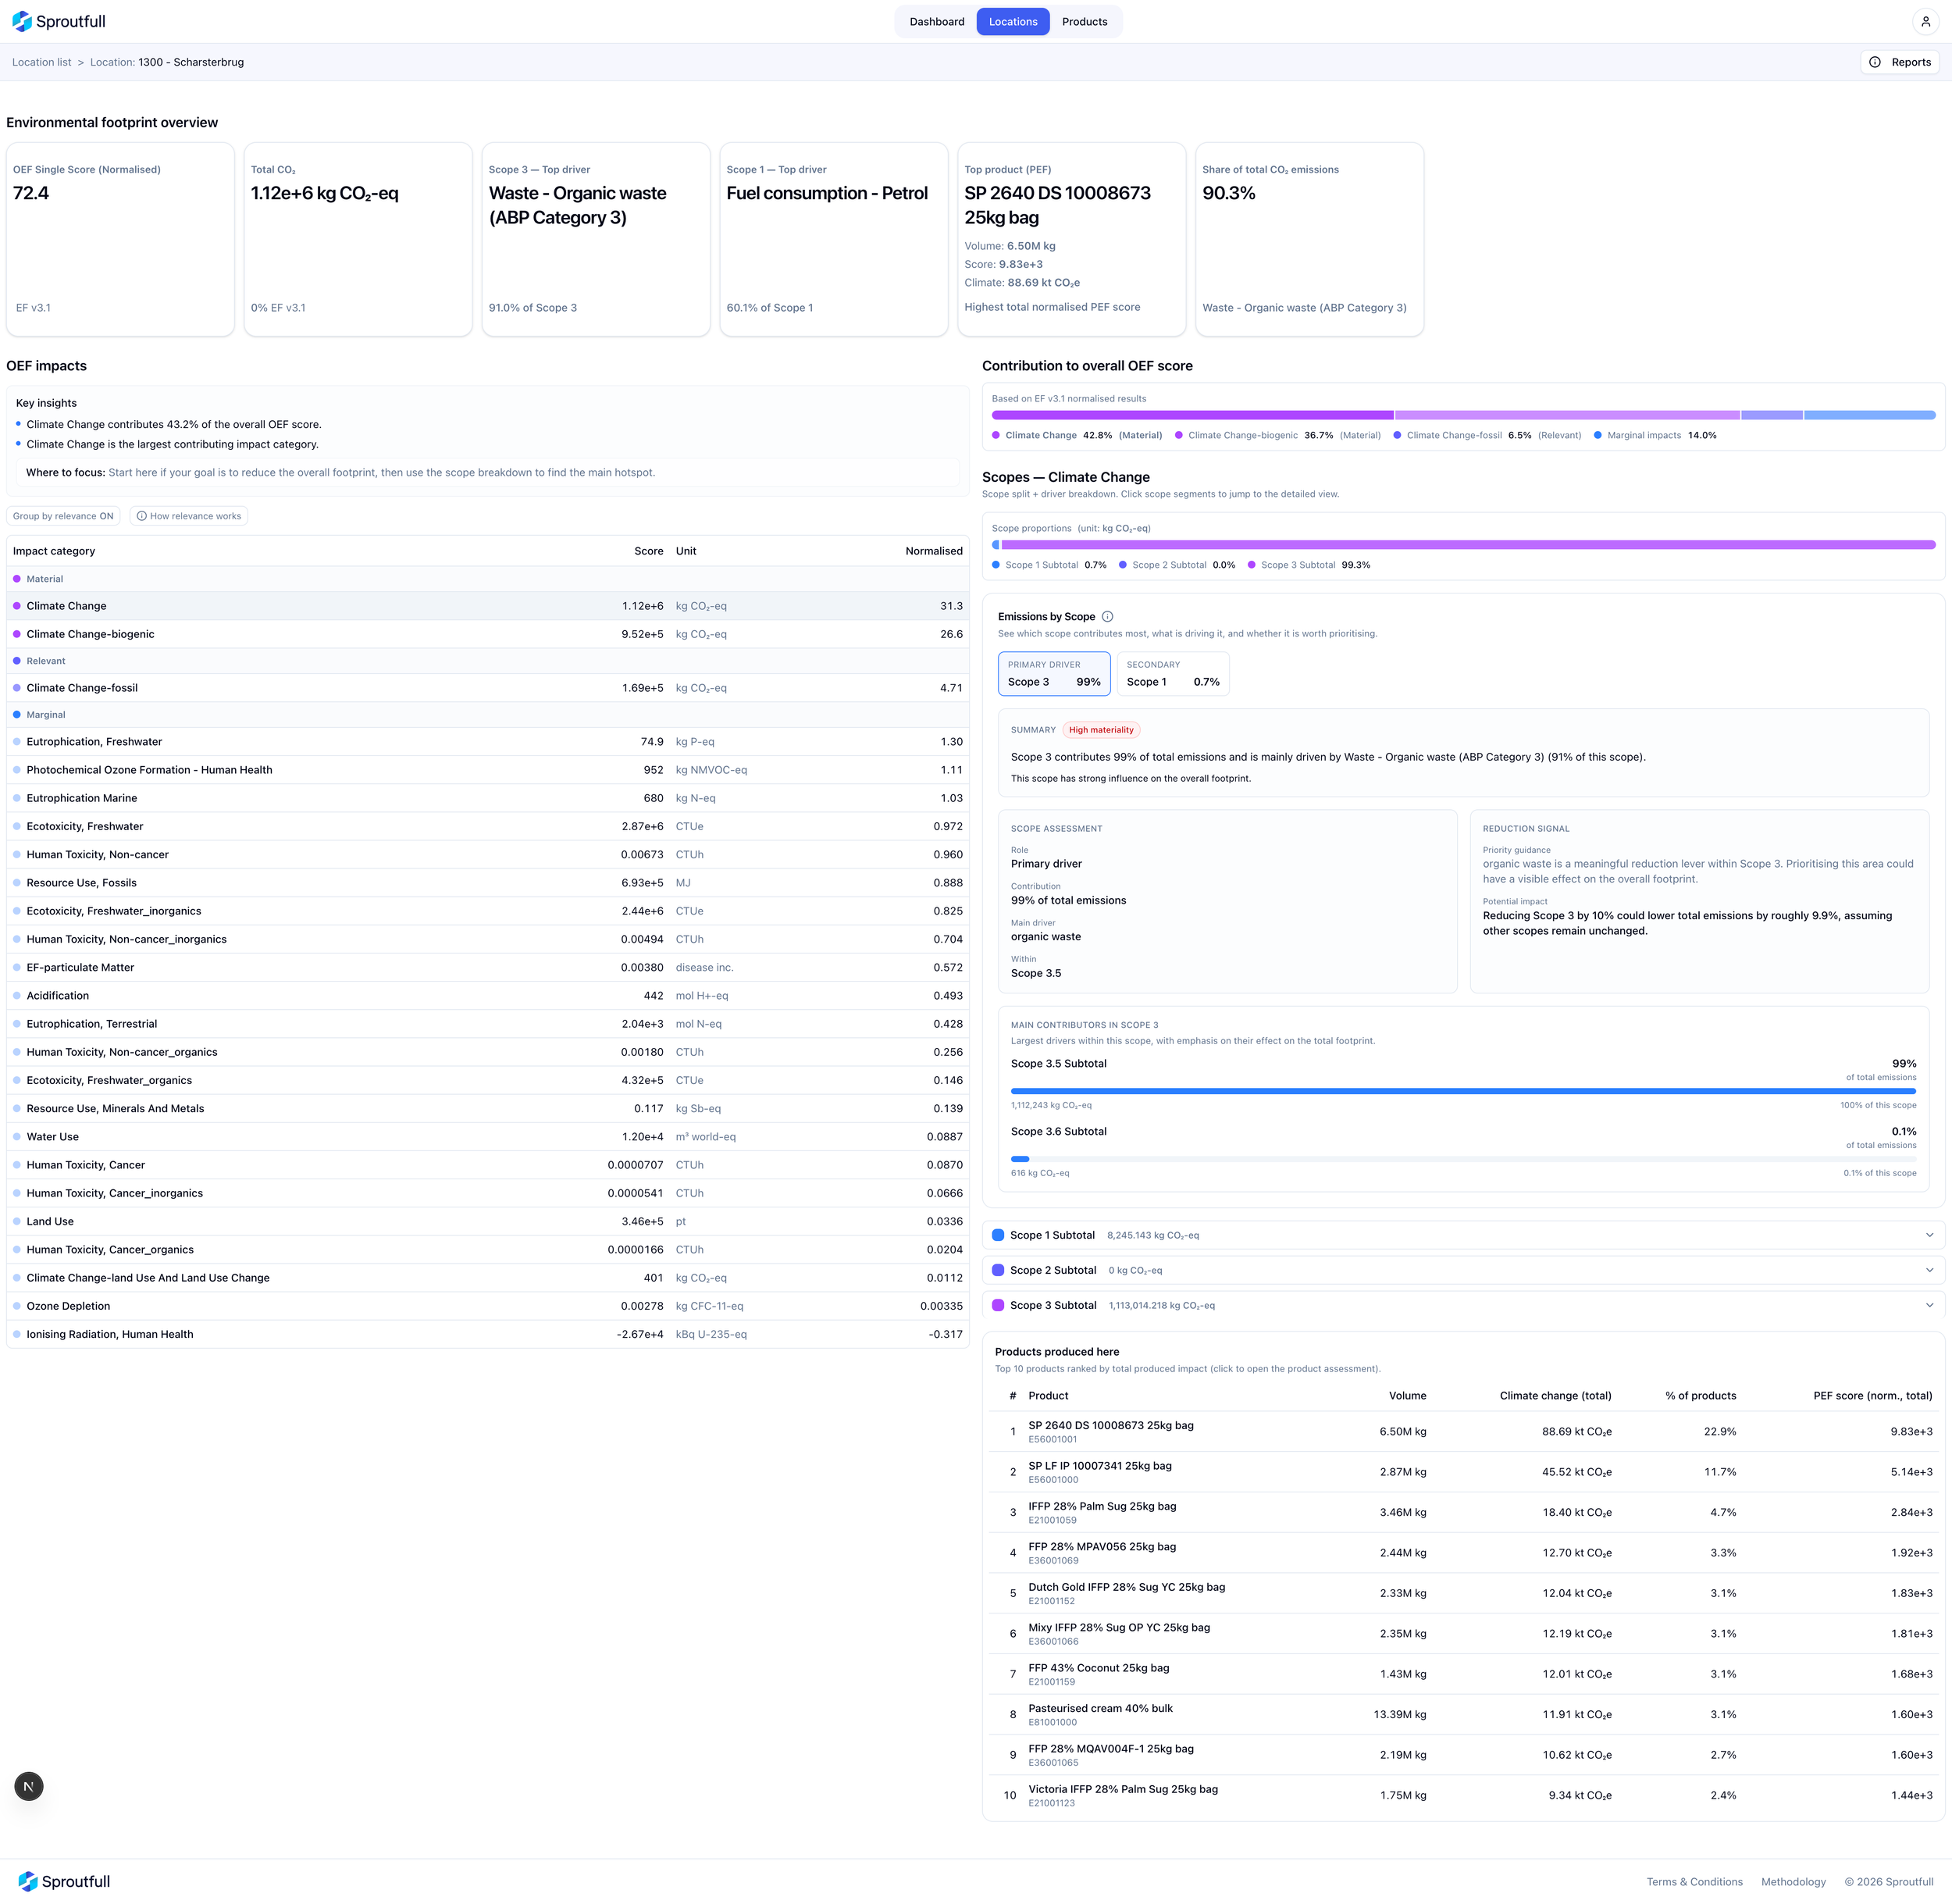
Early Organisation: dense dashboard with OEF, climate, scopes, top location, top driver, top product, and large breakdown tables.
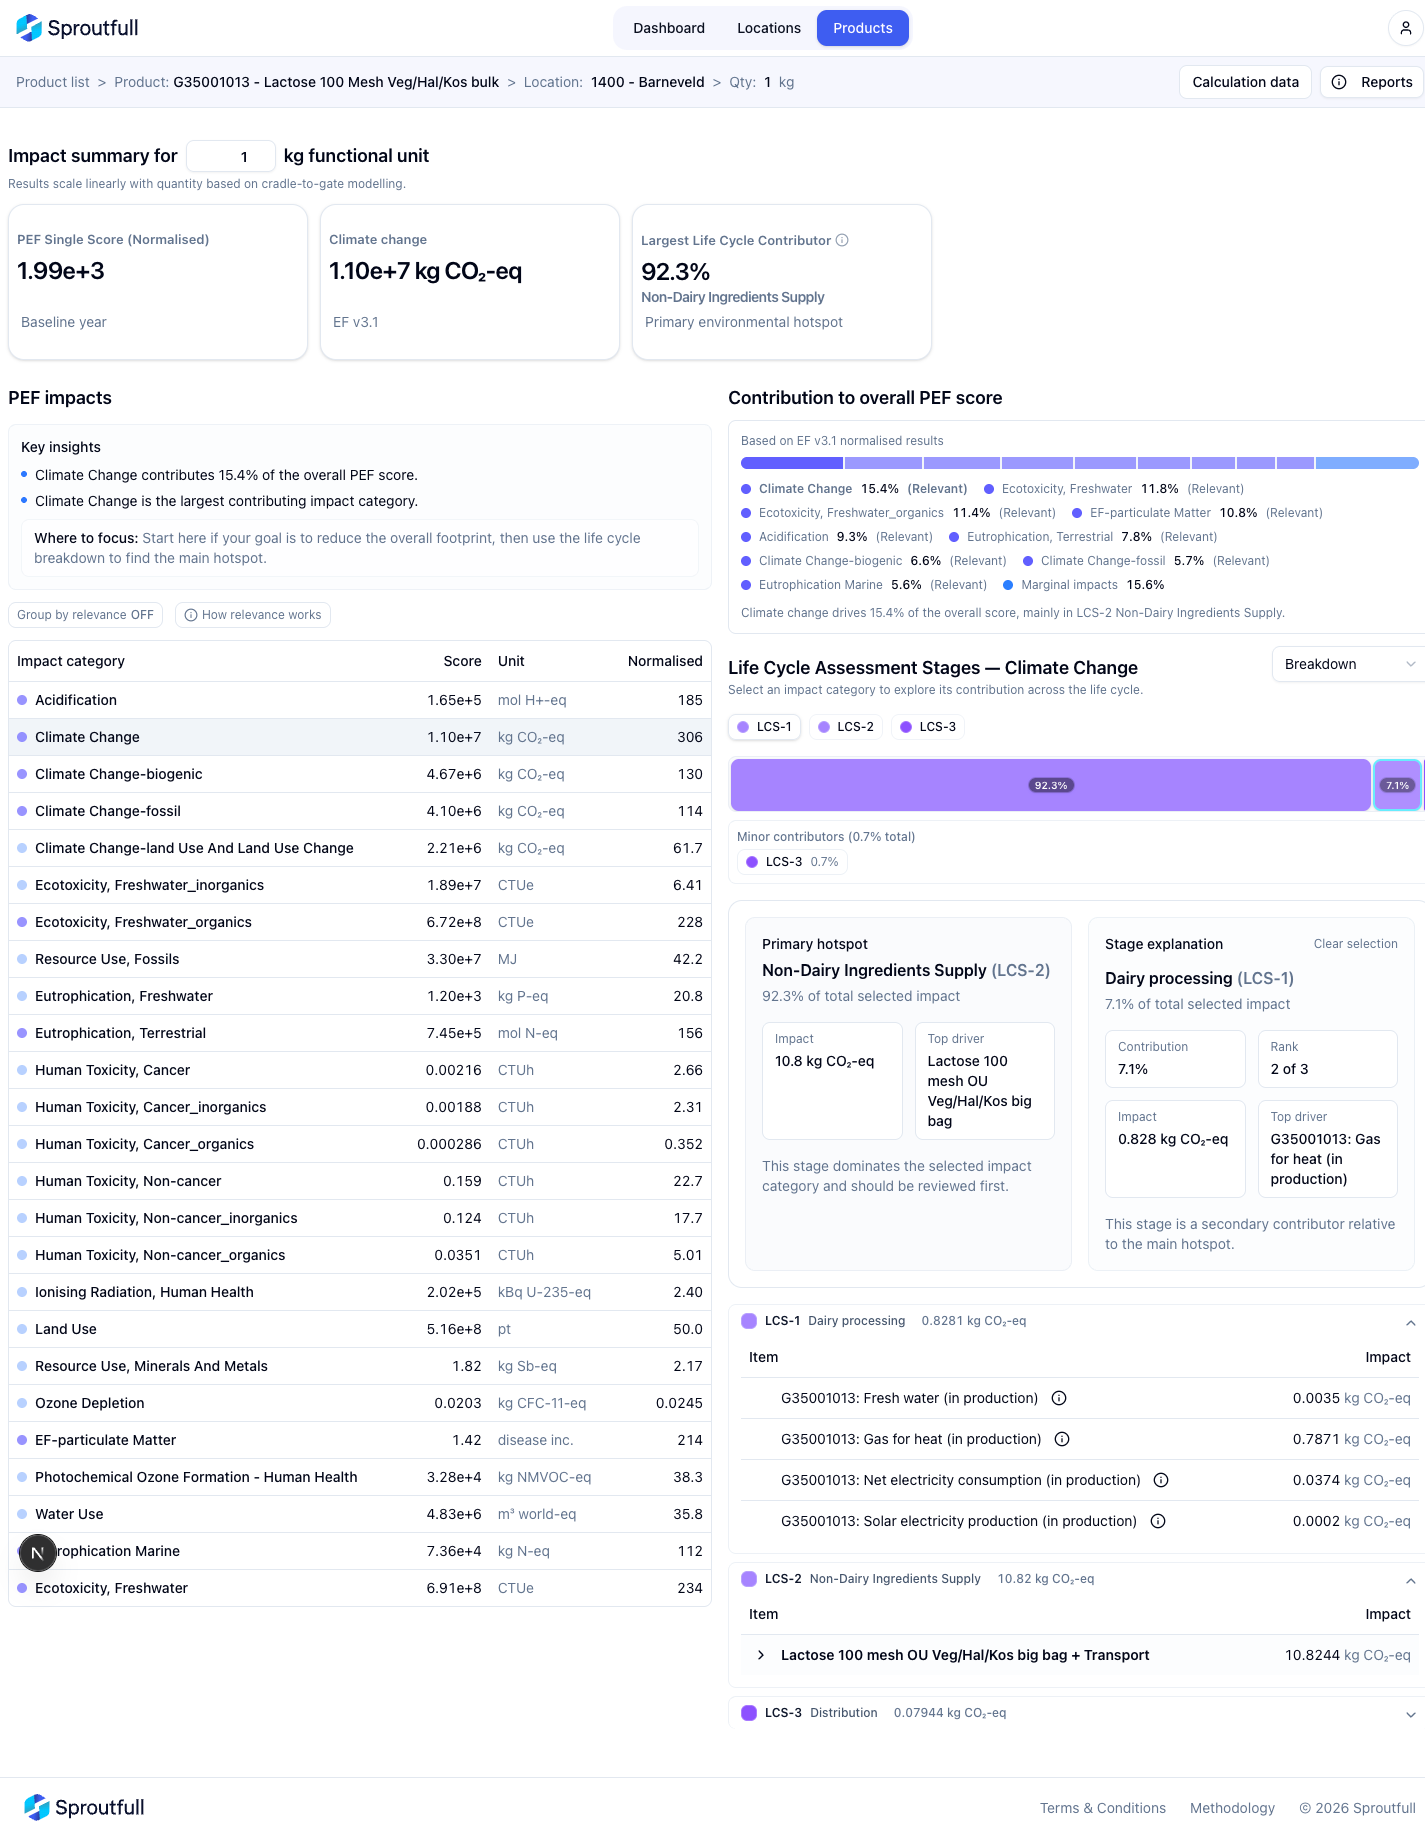
Early Location (above): OEF + Scope breakdown + reduction signal + main contributor.
Early Product (below): lifecycle-stage view with hotspot and contributor analysis.
06 - USABILITY TESTING
Testing changed the model
I tested the early reporting model with a member of Vreugdenhil’s sustainability team.
I wanted to know whether they could quickly identify what mattered, understand why it had been prioritised, judge whether they trusted the result, and know where to go next.
The core idea worked. The participant understood the main priority, followed the evidence trail, and used the breakdowns to investigate why one contributor stood out.
But the hierarchy was making them work too hard.
“If I don’t trust the data why would I invest time in reading further.”
“I just want to be able to scan quickly where is the most impact.”
“The linked products I would put more central.”
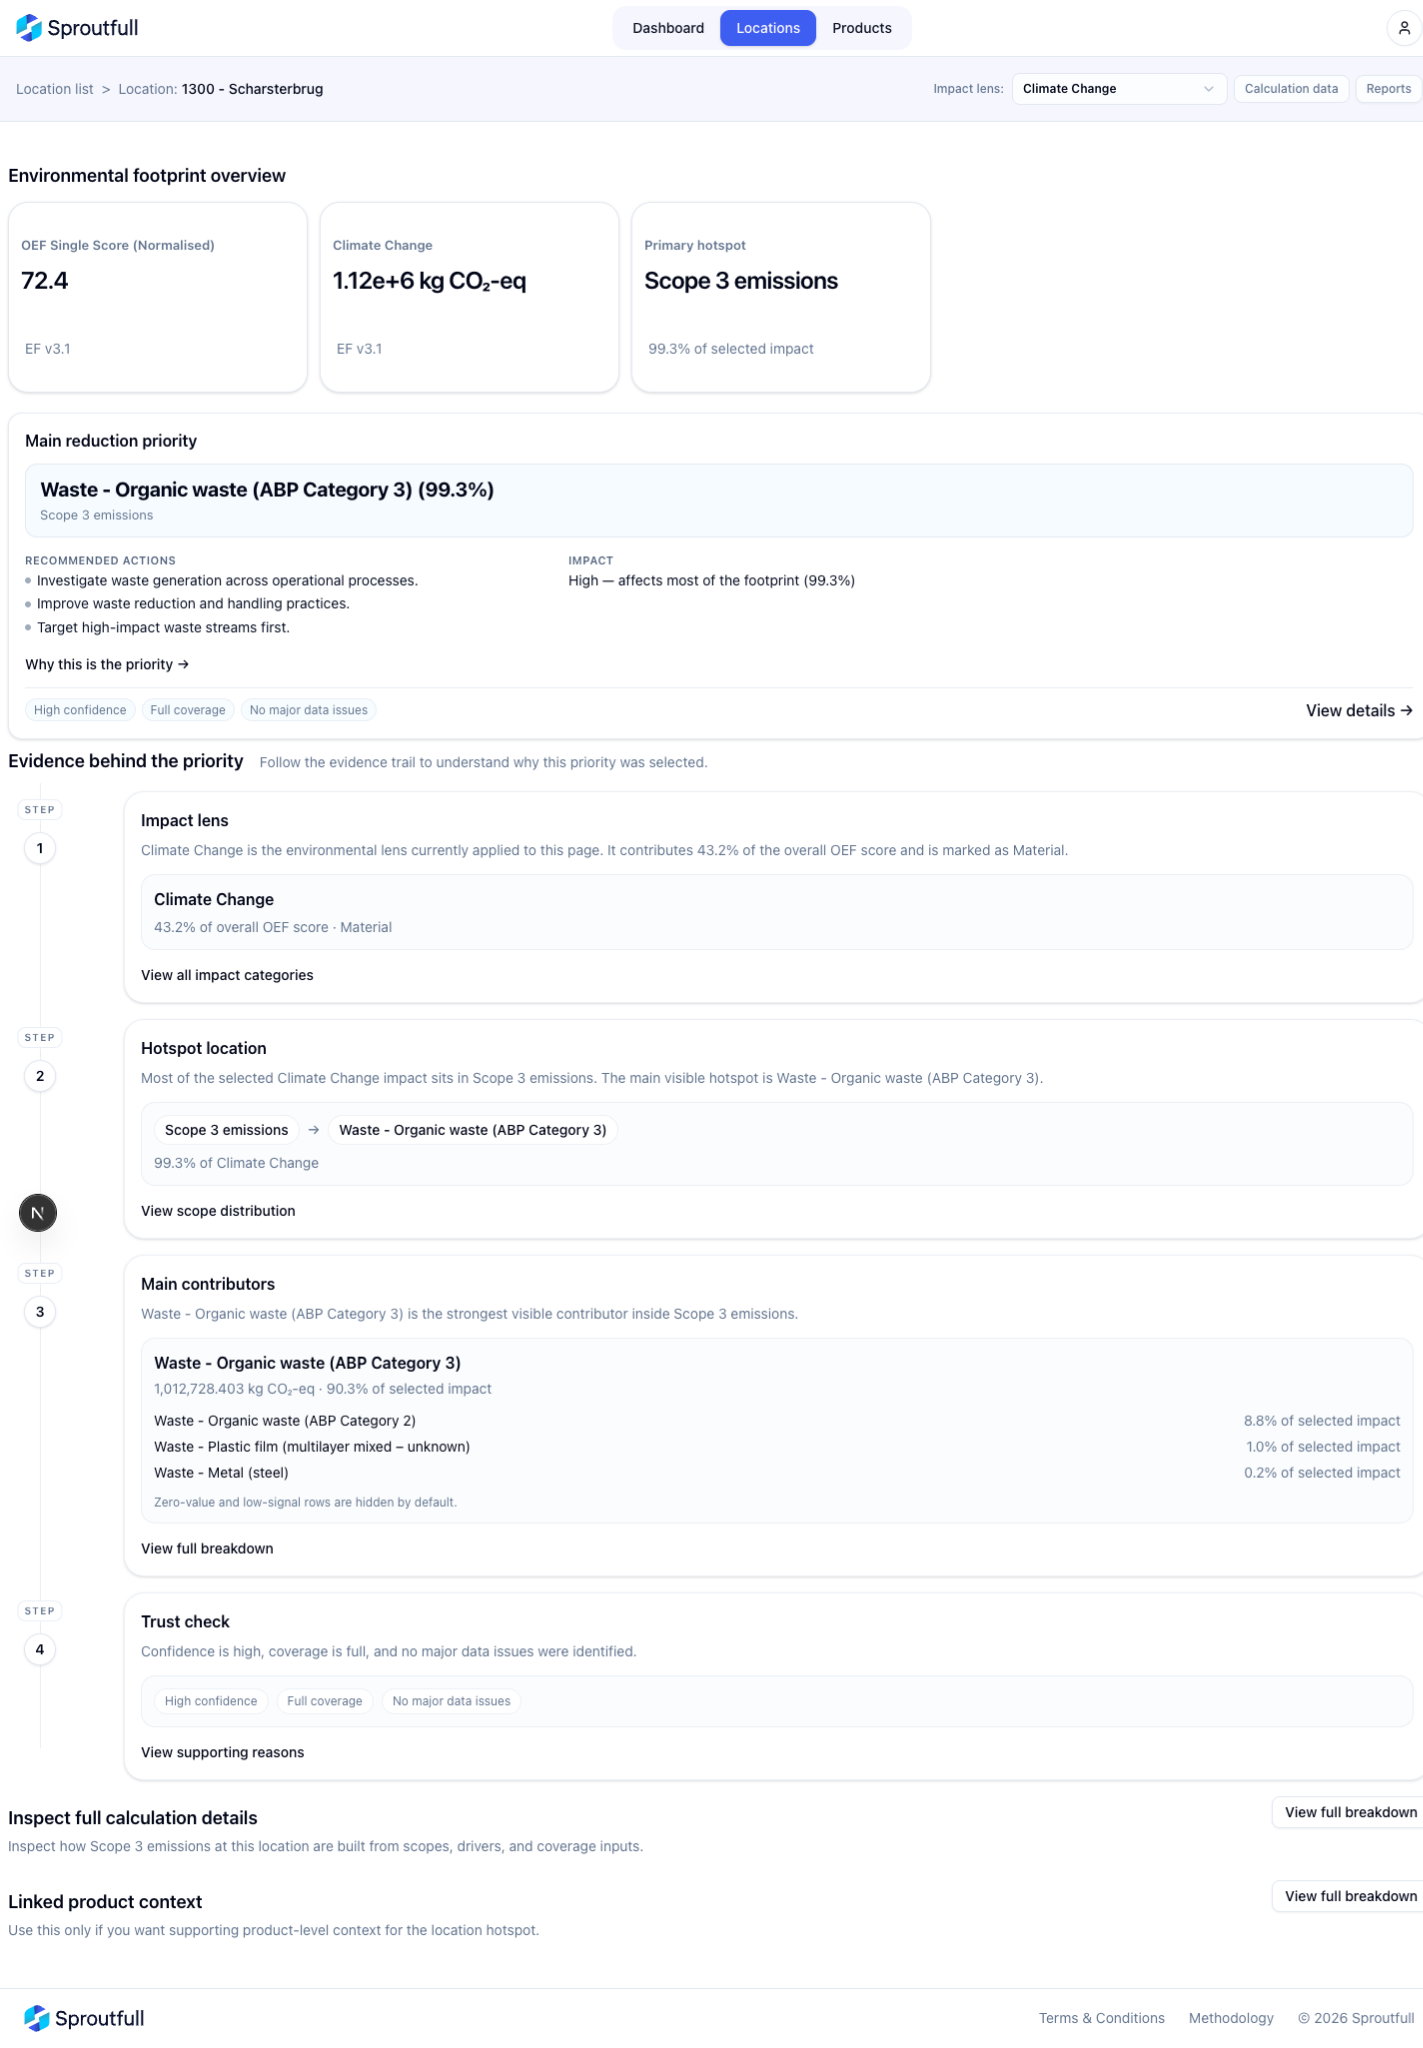
That feedback led to several changes:
CO₂e became the primary metric;
Reliability moved earlier;
Evidence became more focused;
linked-product context moved higher;
dense explanation gave way to progressive disclosure.
The first revision was better, but still too dense. I reviewed it again against the usability feedback and simplified the hierarchy further.
The test did not overturn the direction. It showed that the decision journey worked, but the structure needed to get out of the user’s way.
07 - TRUST & RELIABILITY
Designing for trust
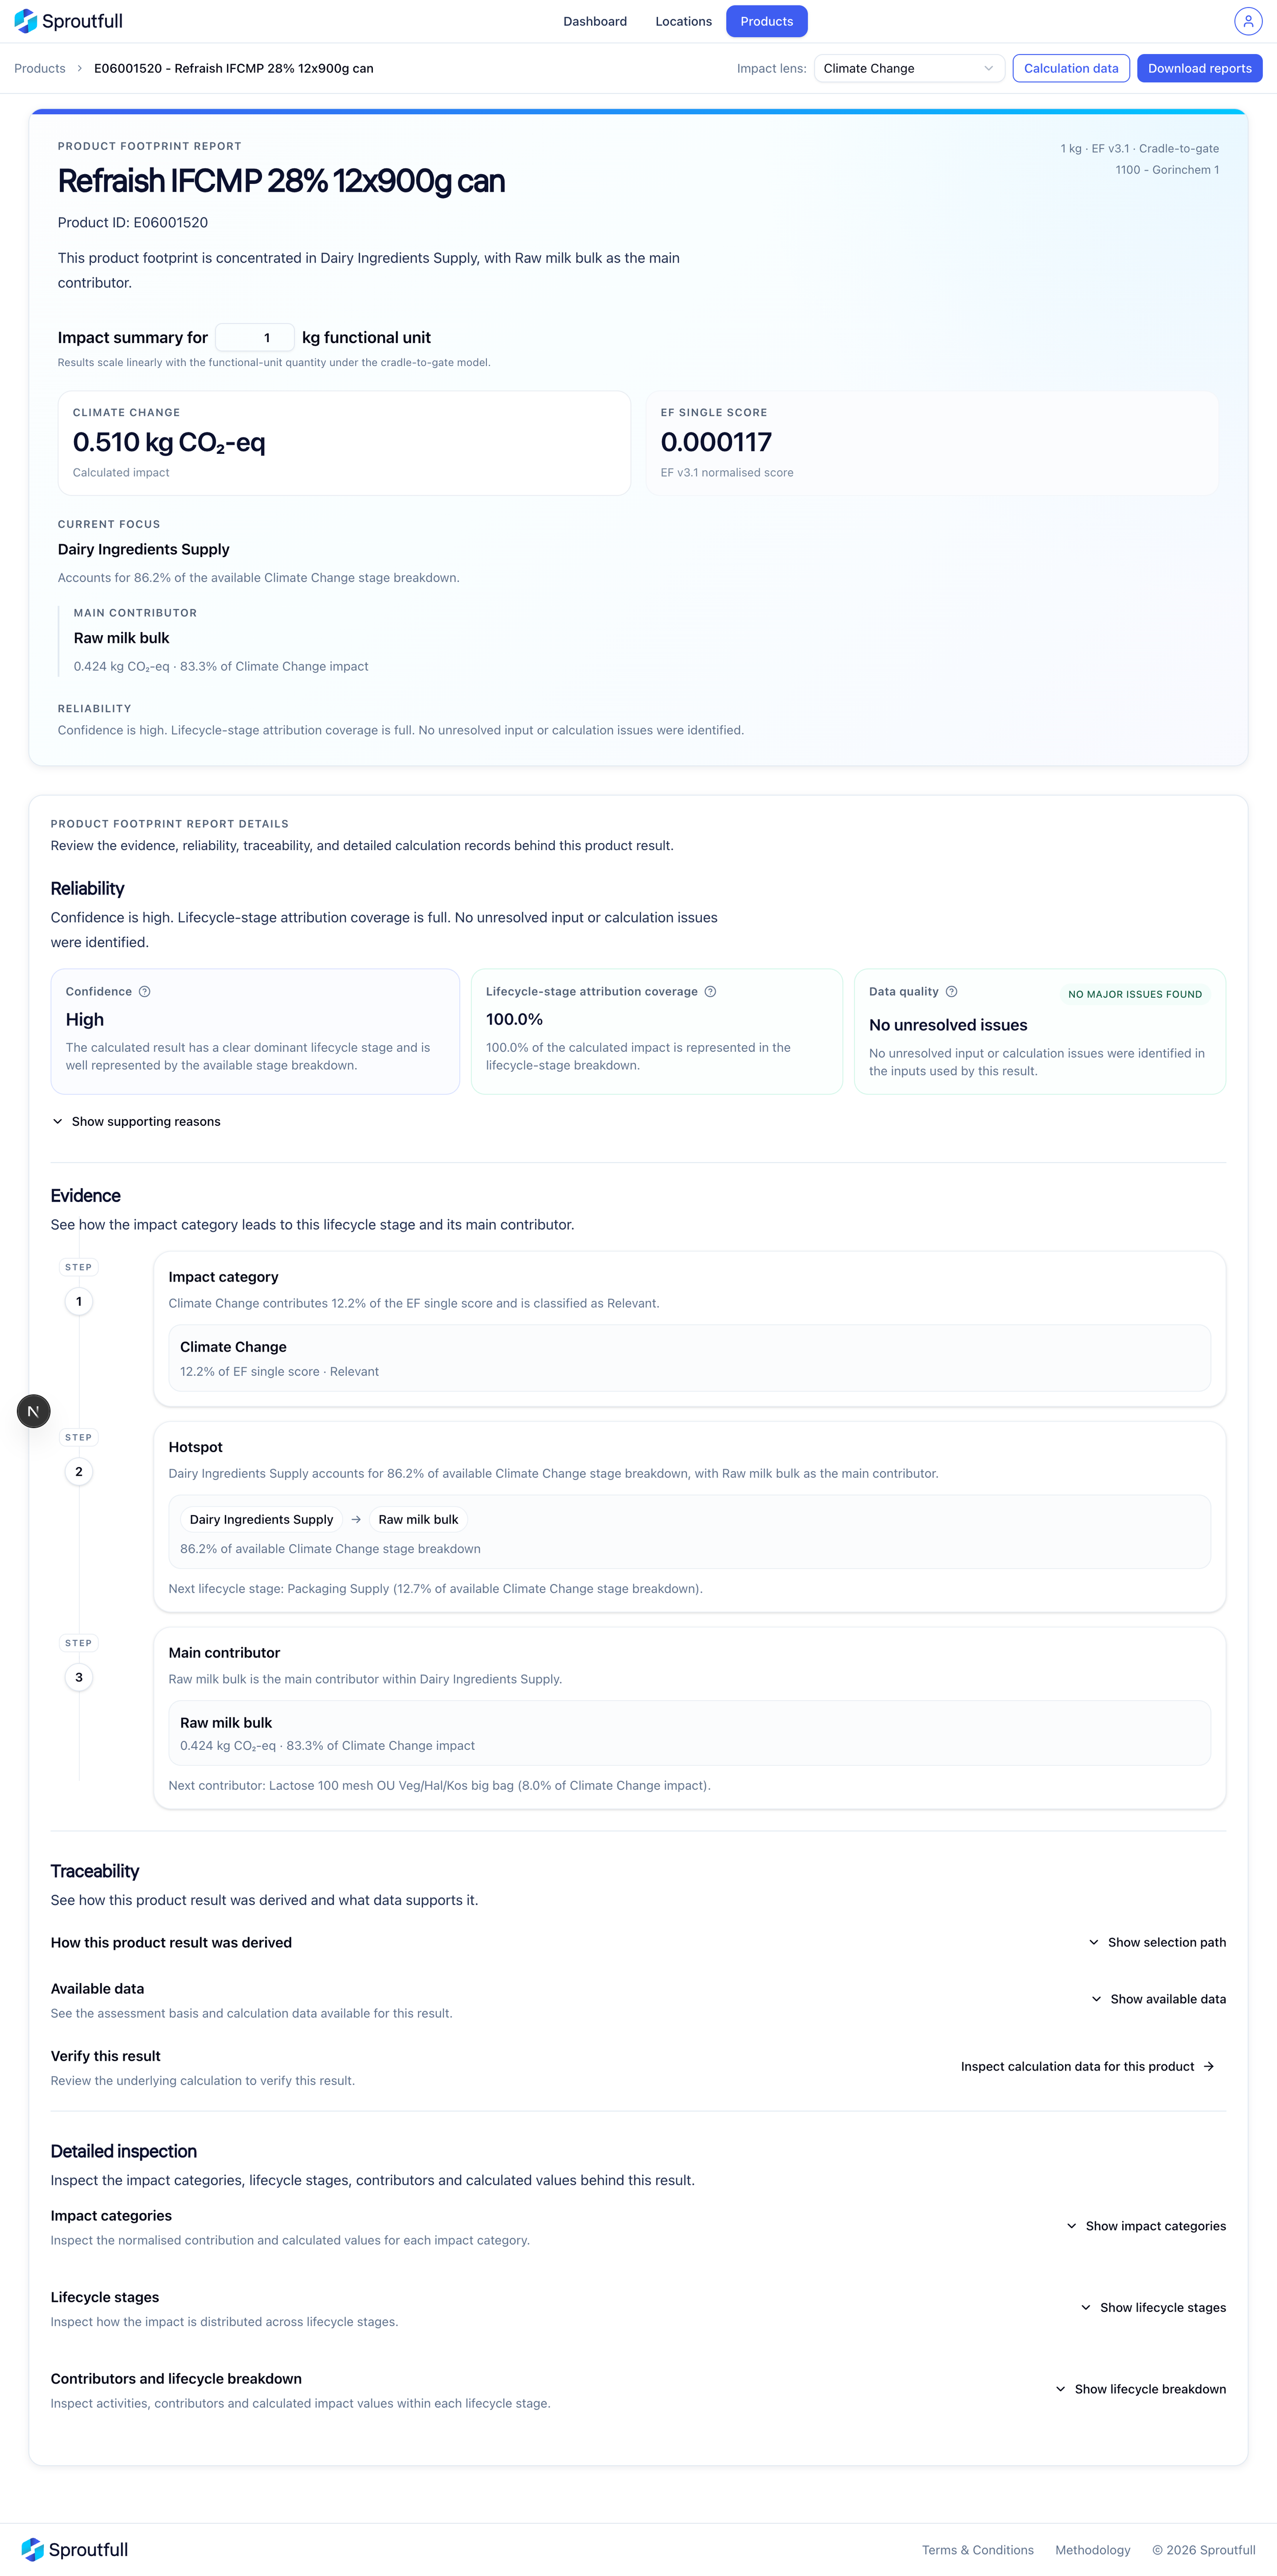
The usability work exposed a deeper issue: decision support only works if people understand how much confidence to place in the result.
The feedback made it clear that trust needed to appear earlier and become more concrete.
That pushed me to separate four different questions:
Reliability
How much confidence should I place in this result?
Evidence
Why has this focus or priority been selected?
Traceability
Where did the result come from?
Detailed inspection
What does the underlying calculation contain?
I also chose not to hide poor or incomplete data behind a cleaner interface. Missing inputs, coverage gaps and assumptions were part of the decision context, so they needed to be visible.
Instead of vague reassurance, the product needed to show what was missing, how much was covered, and what assumptions had been made.
The goal was not to tell users to trust the number.
It was to give them enough information to decide how much they should trust it.
08 - UX ENGINEERING
Carrying product decisions into code
Sproutfull did not have a clean design handoff.
I stayed involved from the product model through to the working interface, using React and TypeScript to test whether the experience still made sense once it met real data and product constraints.
AI became part of that workflow too. I used it to inspect the codebase, challenge implementation assumptions, refactor shared logic and generate regression tests. It increased the breadth and speed of what I could cover, but user evidence, domain expertise and product judgement remained the source of truth.
That created a tighter loop:
Design → Build → Inspect → Test → Refine
One example was the idea of a “main contributor.”
On the surface, it is a simple UX label. But for it to be trustworthy, the product had to agree on what could be compared, how missing values should behave, how ties should work, and which denominator made a percentage valid.
I defined those product rules first.
Then I used Codex to audit the existing ranking paths, implement shared logic and generate regression coverage across Organisation, Location and Product.
The validation covered edge cases such as missing values, zeroes, ties, hierarchy differences and cross-route consistency.
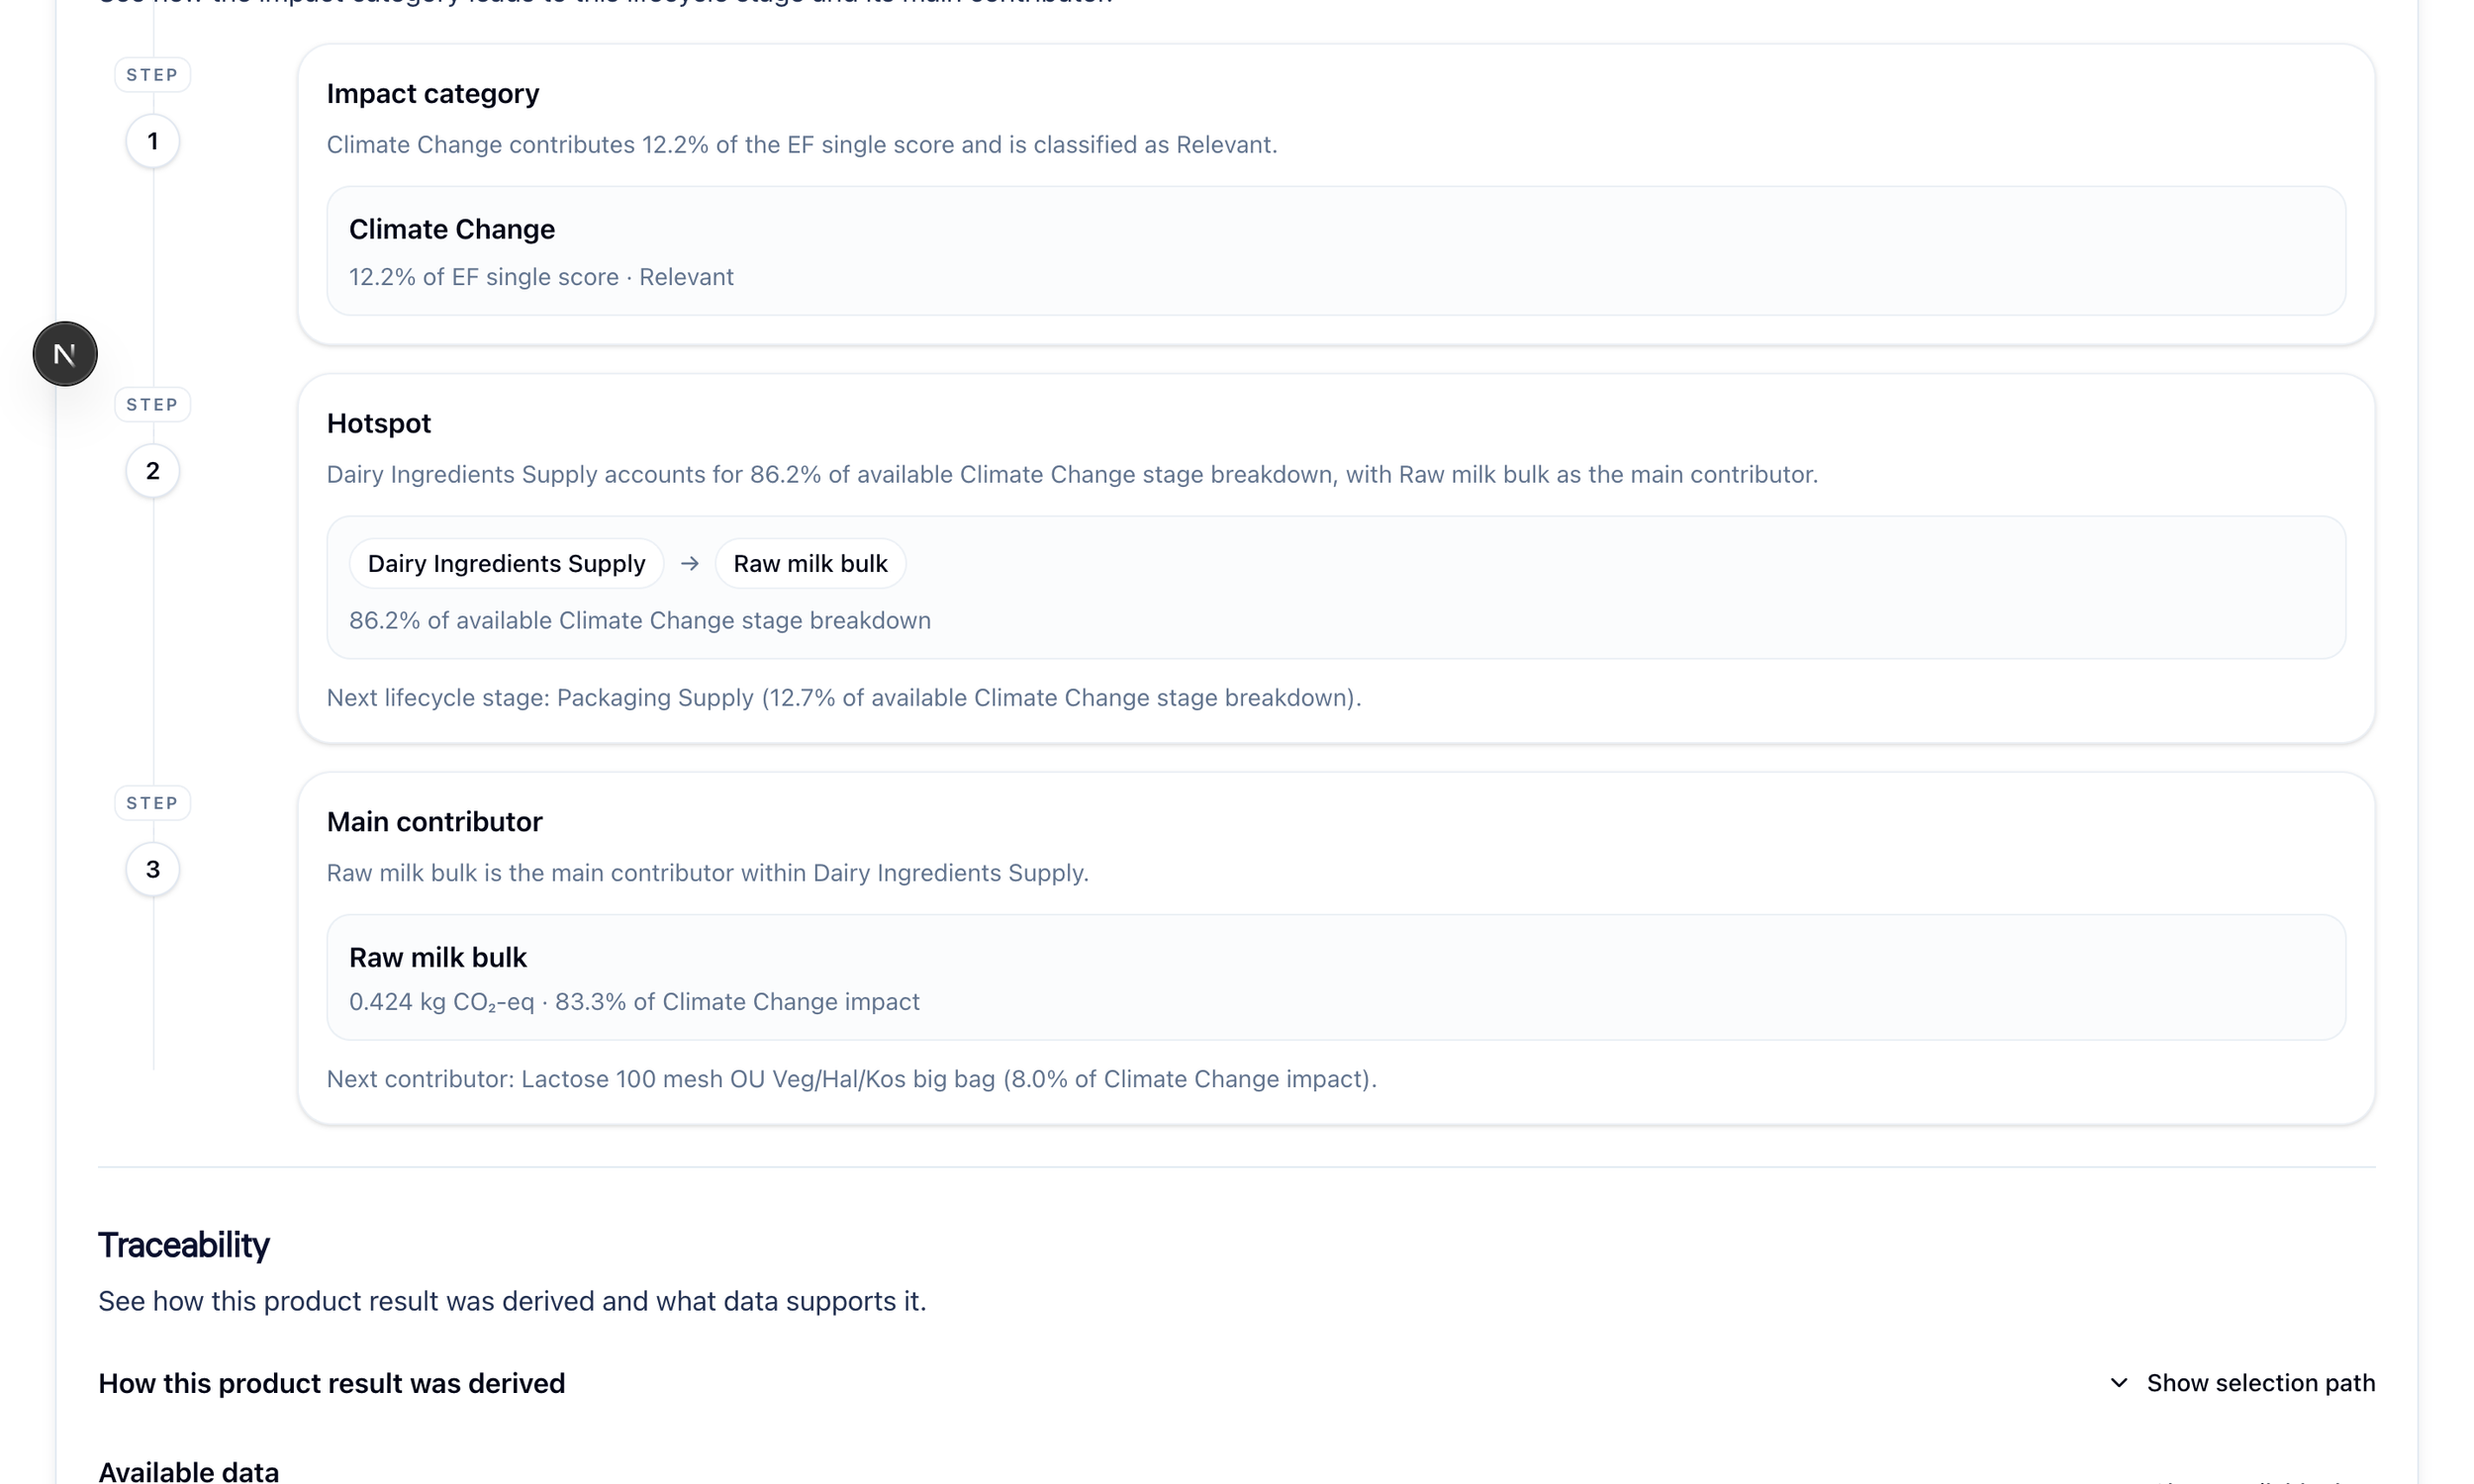
A simple label like “main contributor” depended on shared rules for comparability, missing data, ties and valid contribution percentages.
AI helped me apply and validate the rules at scale. It did not decide what those rules should be.
That was where UX engineering added the most value: I could move beyond how the interface looked and help define whether what it said was actually true.
09 - PRODUCT SYSTEM
Making the learning reusable
As the reporting model matured, I wanted the reasoning behind it to survive beyond individual screens.
Organisation became the first reference implementation. Once that model stabilised, I used the same product questions to shape Location and Product rather than redesigning each reporting level from scratch.
I then turned the learning into three connected layers:
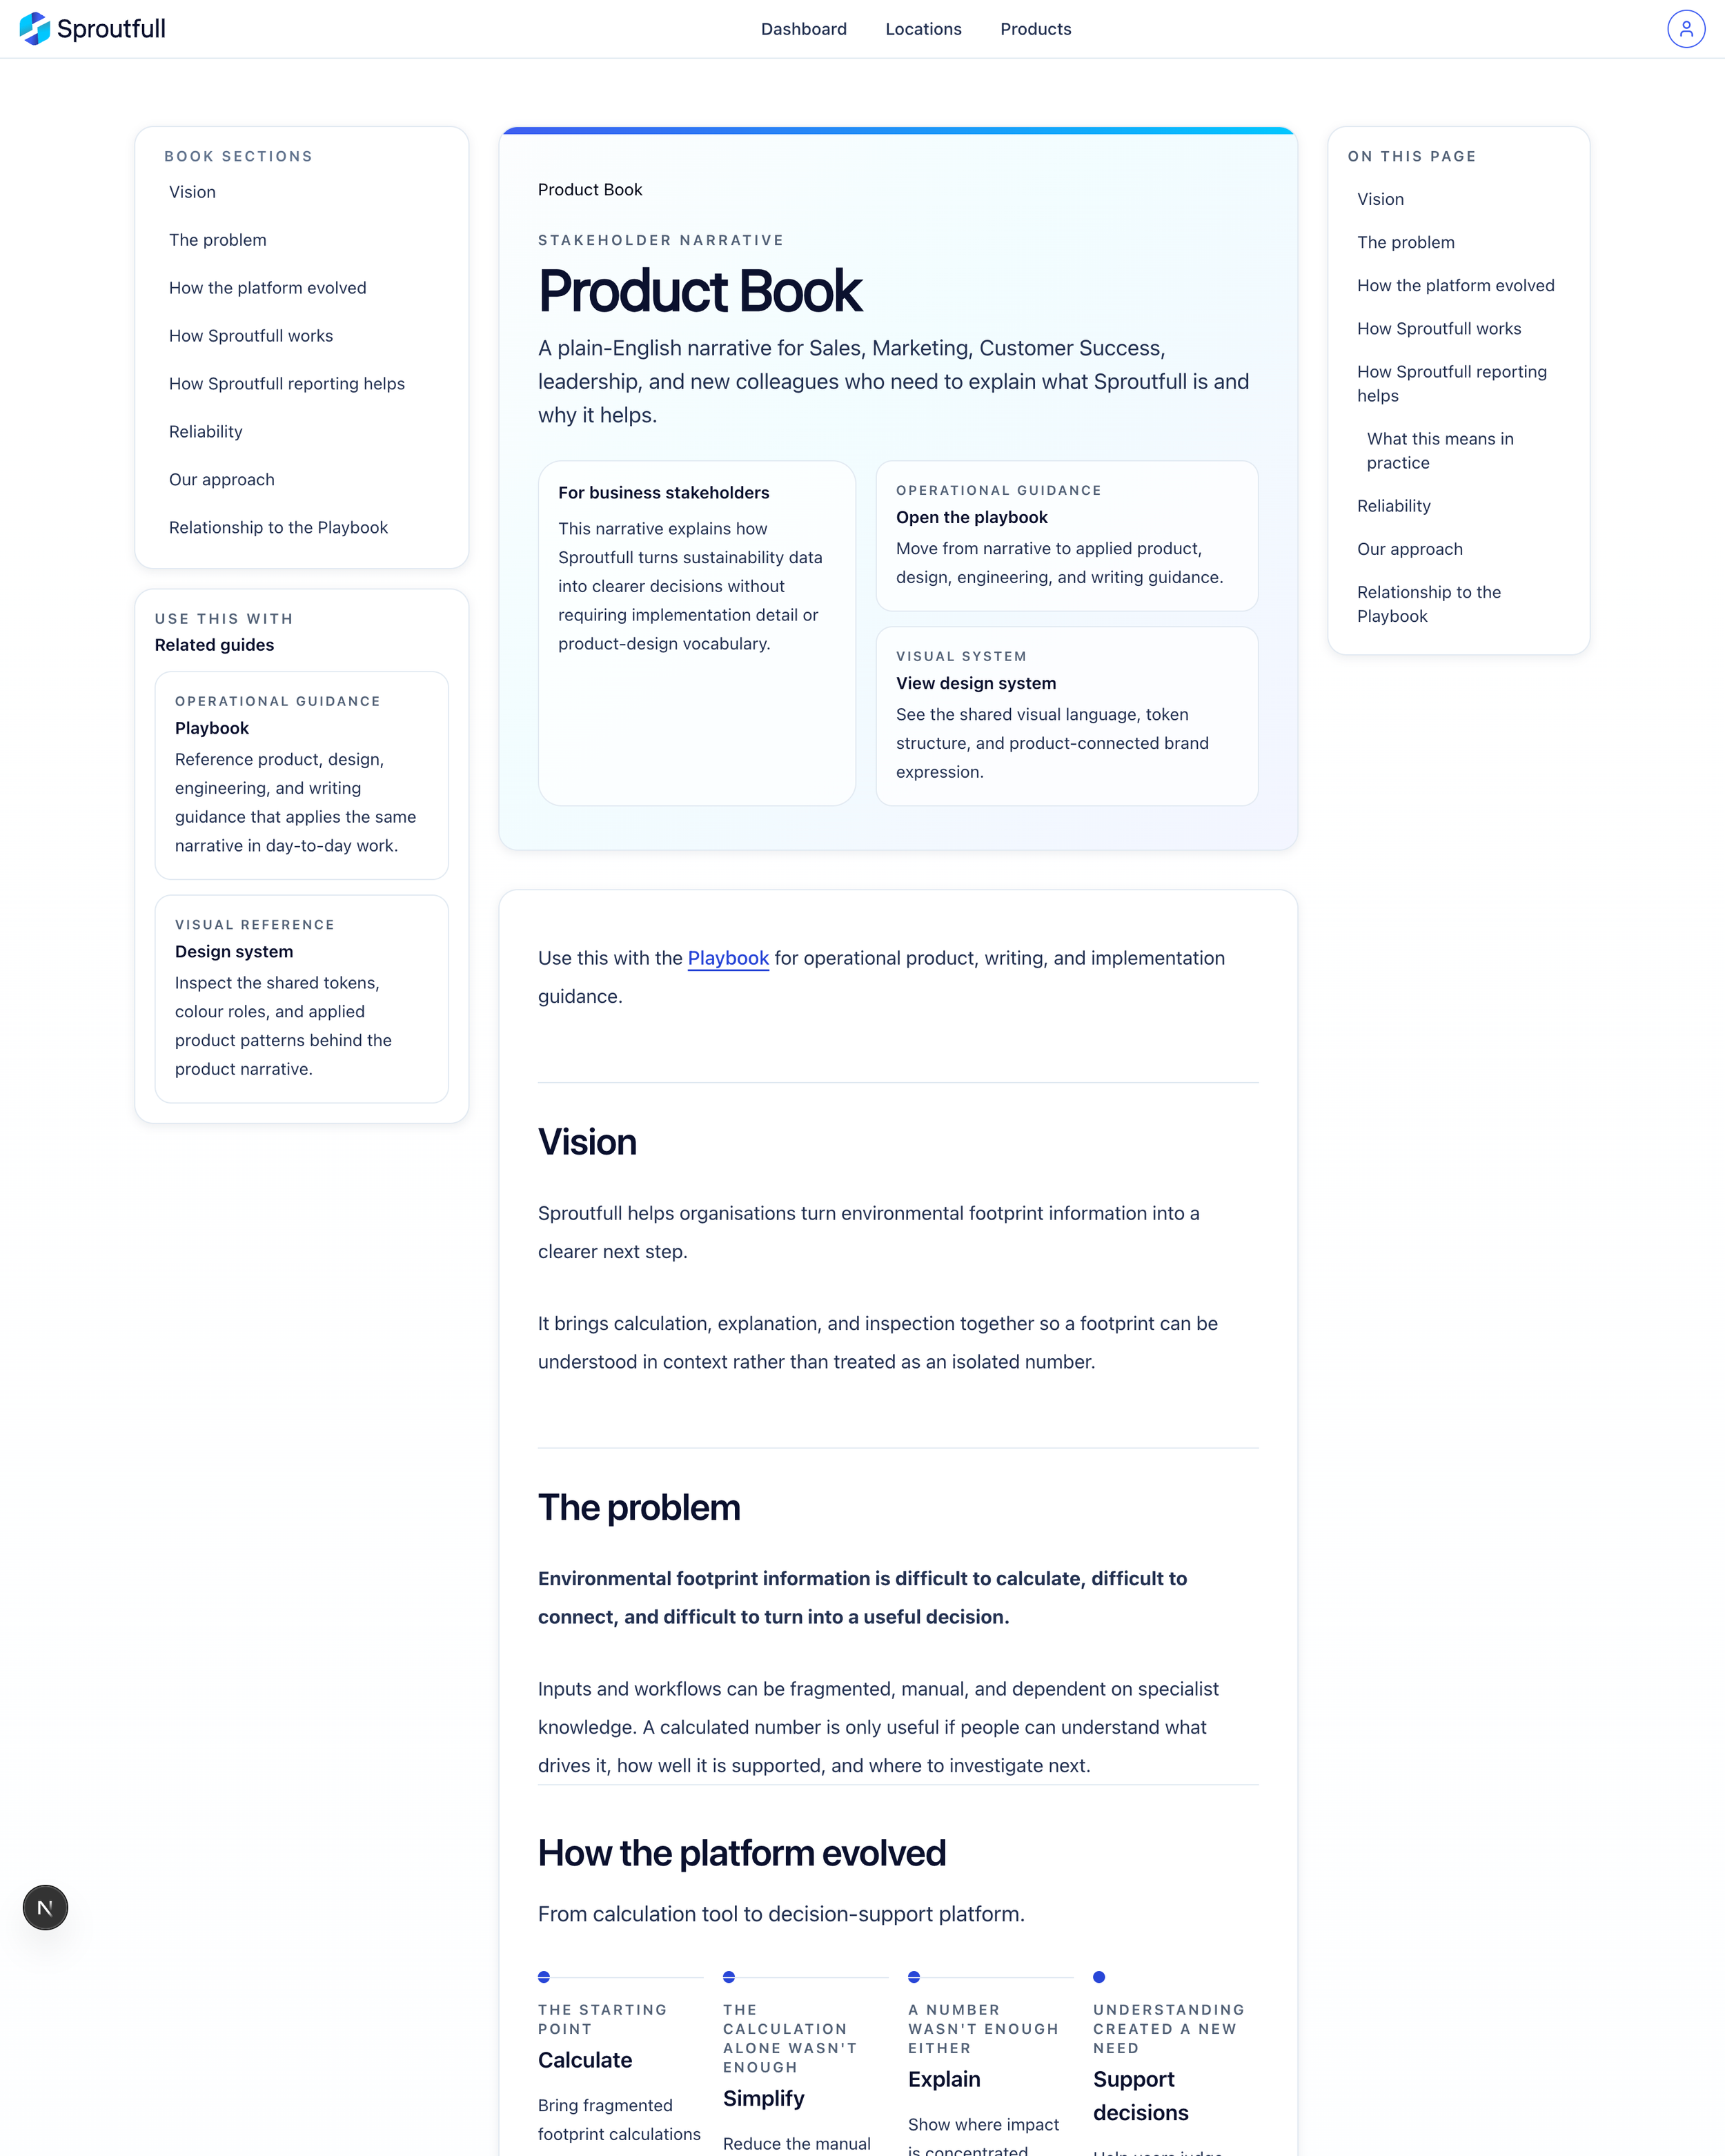
Product book - Intent
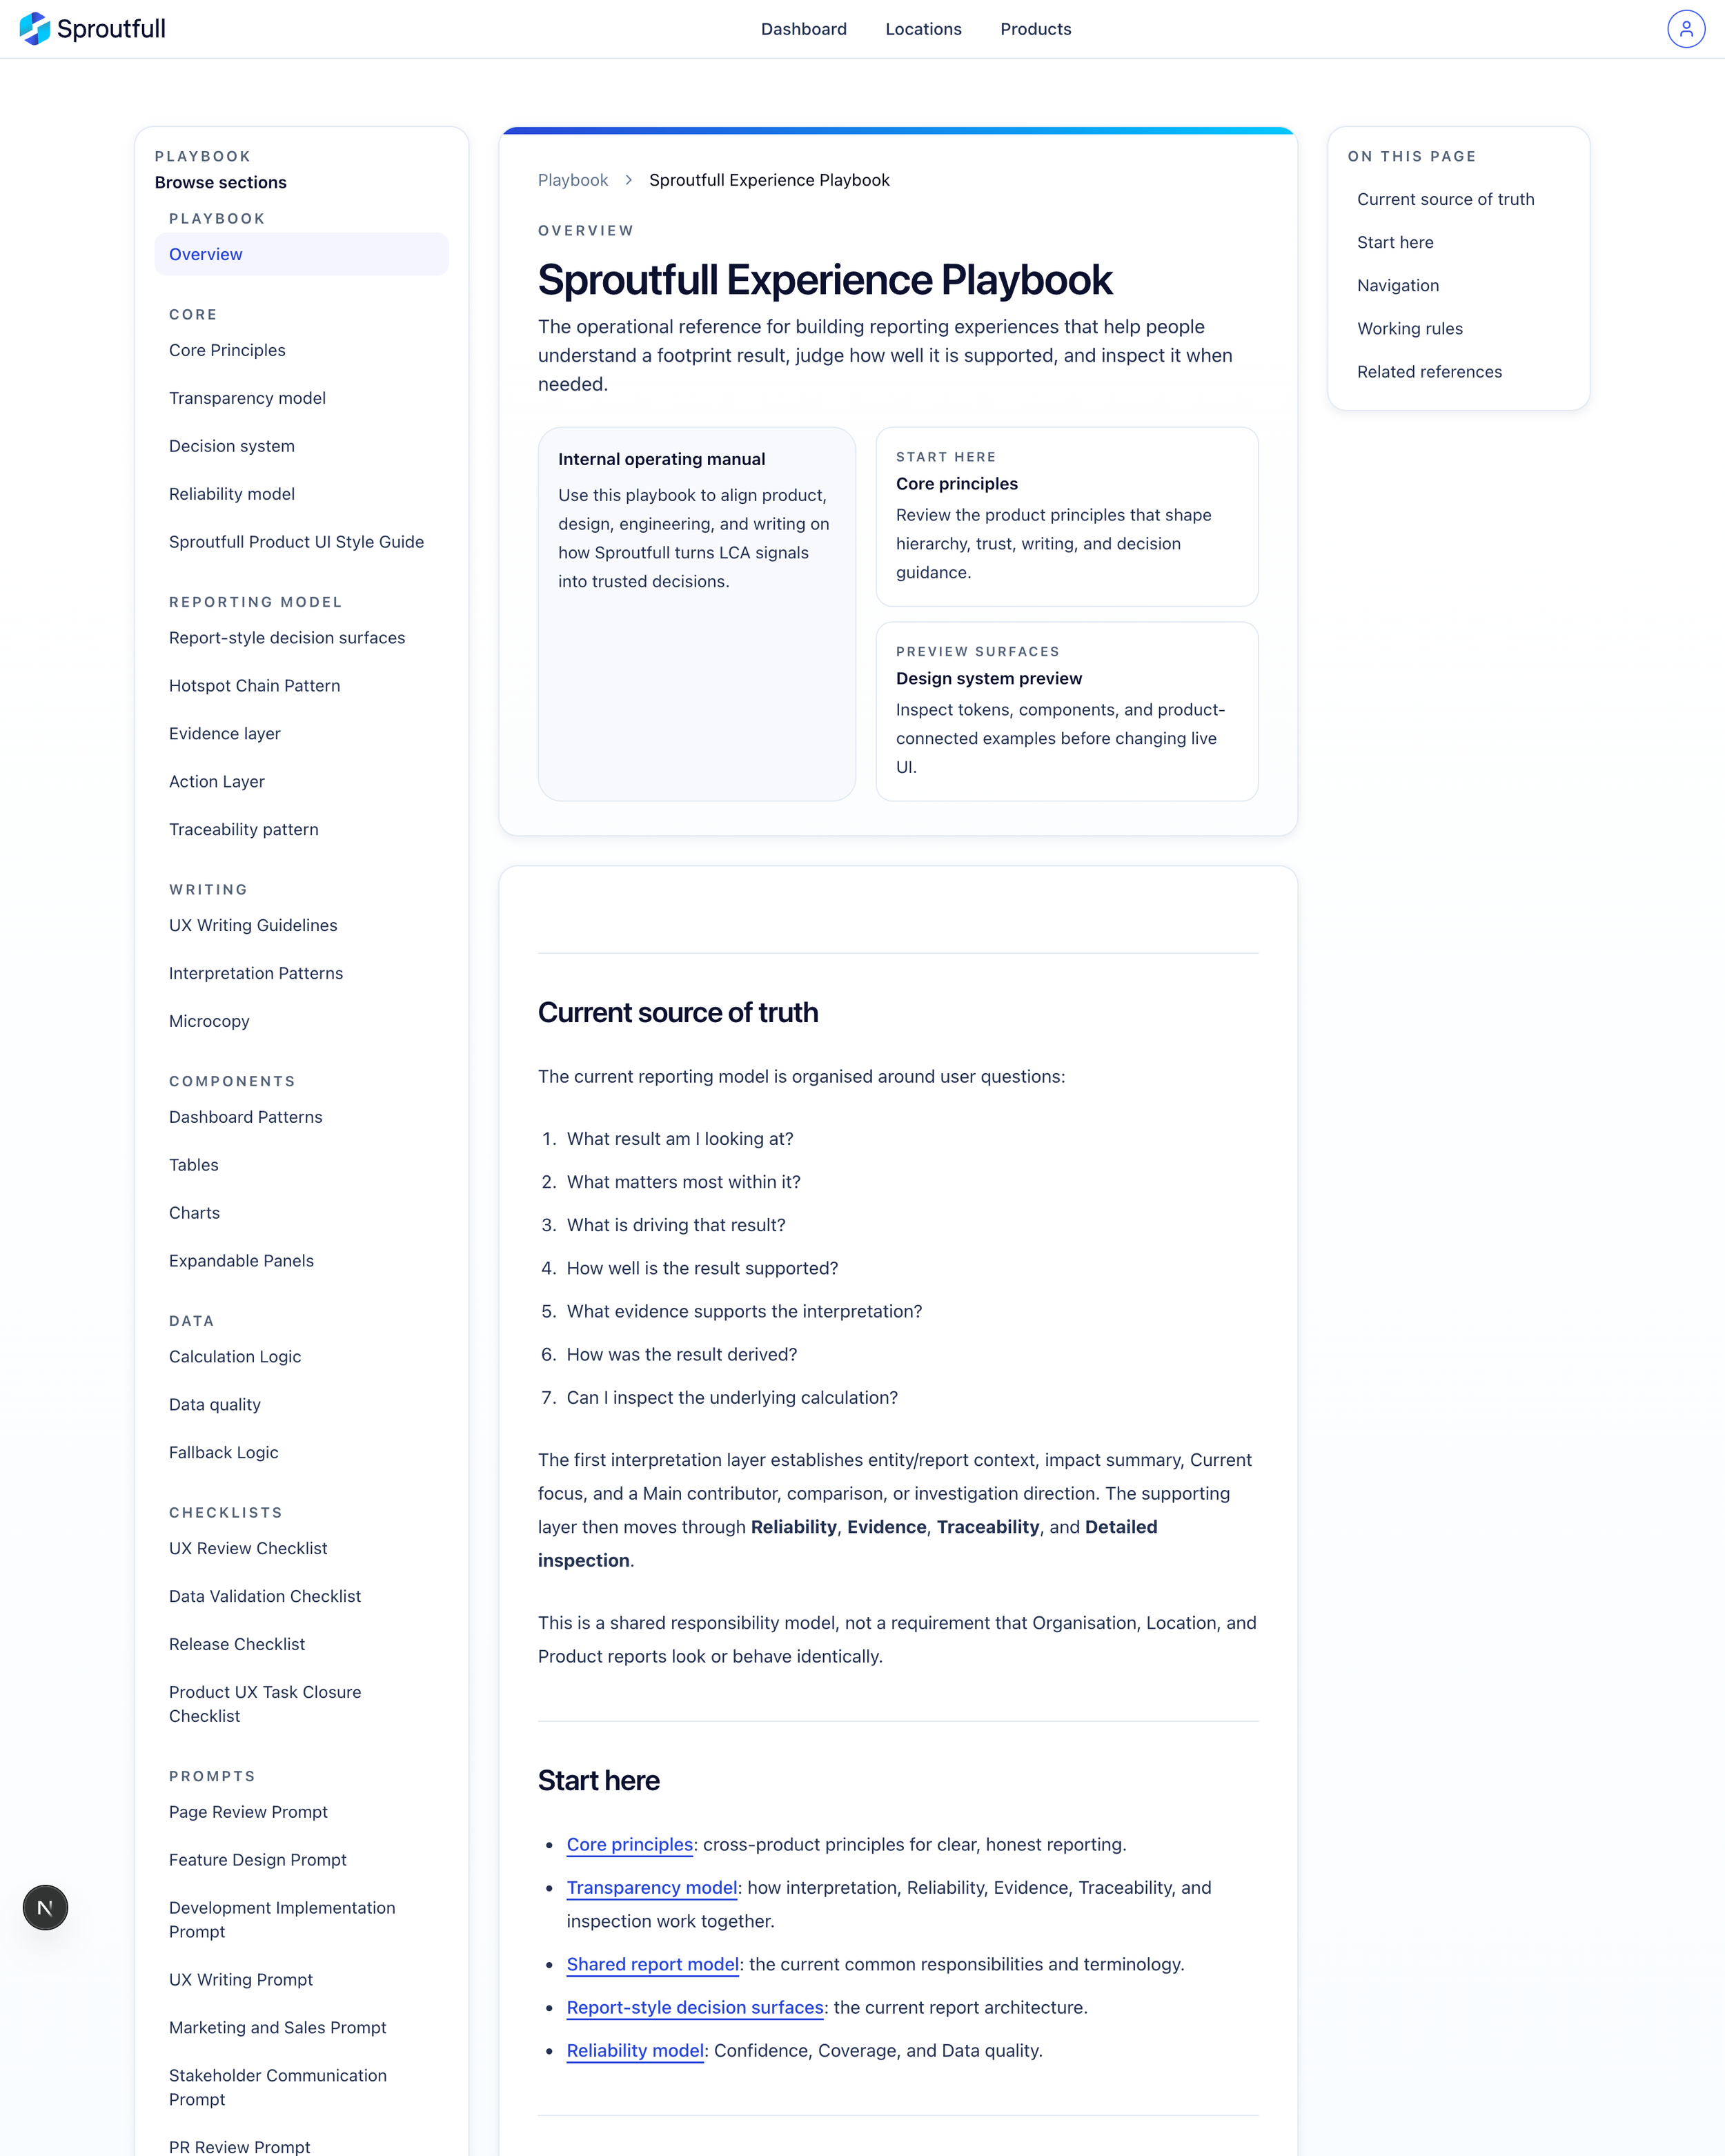
Playbook - Rules
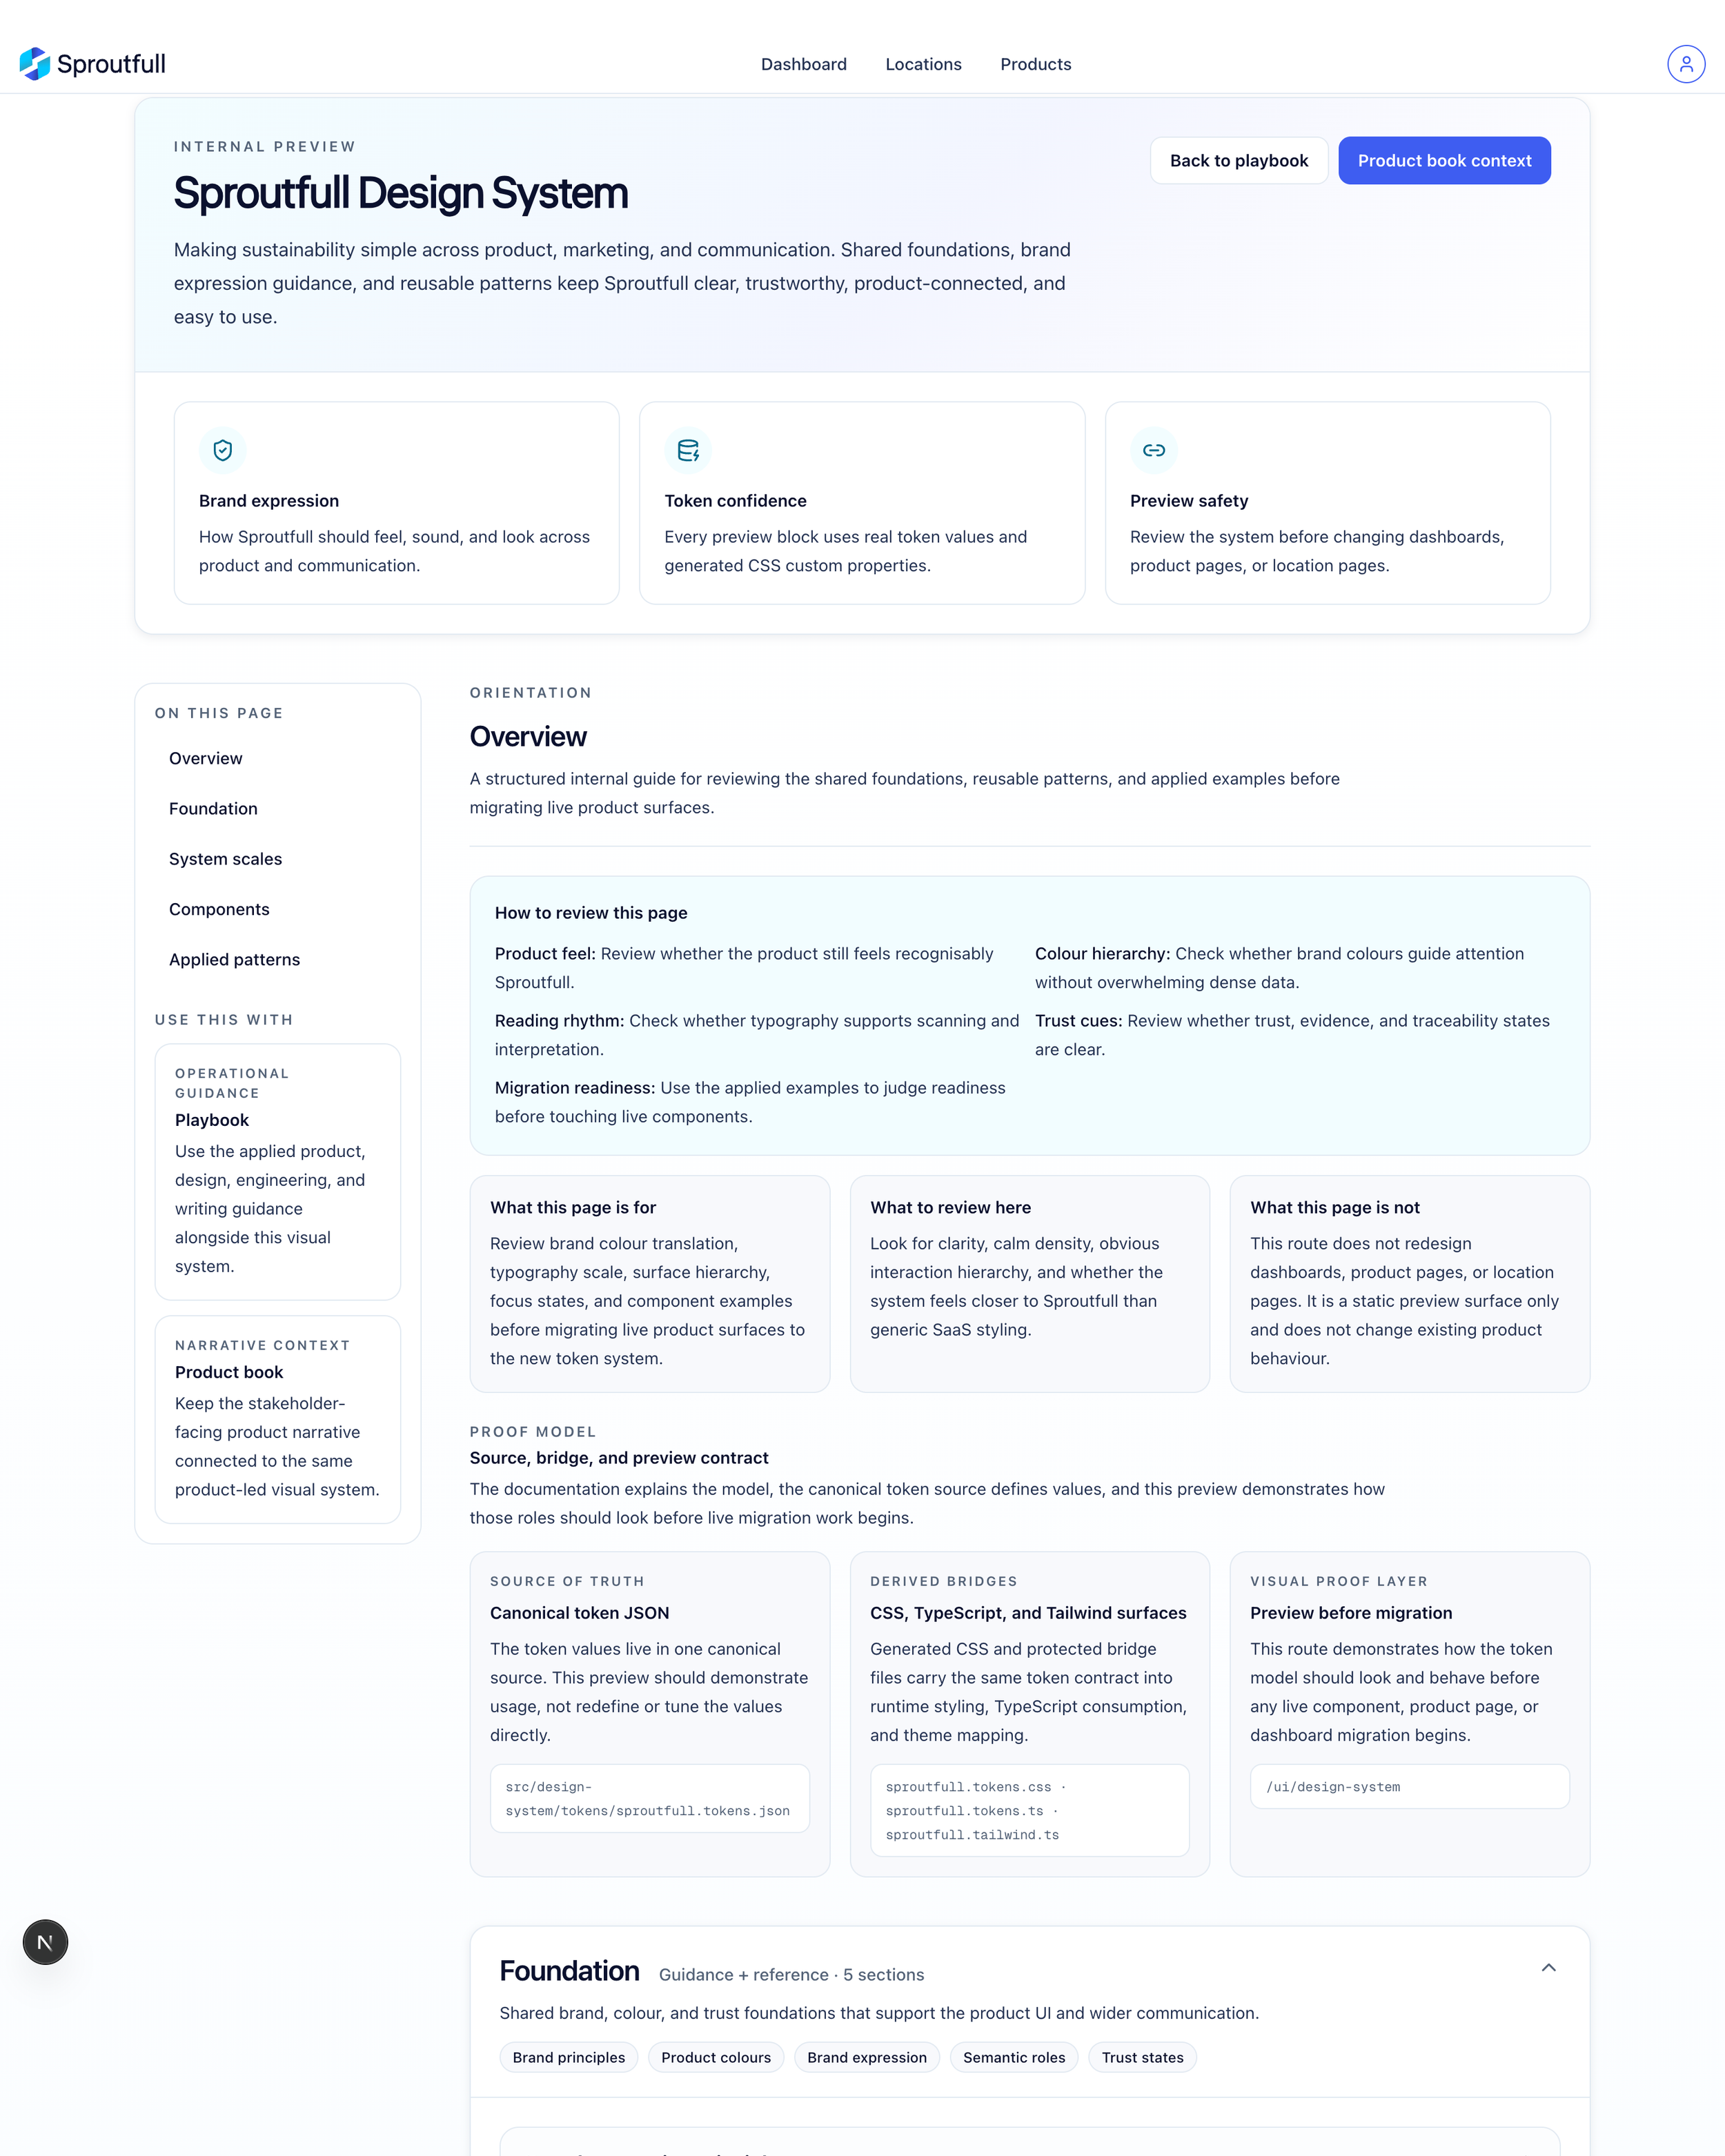
Design System - Patterns
The model became:
Product intent → UX rules → interface patterns → shipped experience
New reporting work could now start from an established product model rather than reopening the same structural questions each time.
Shared components and automated tests then helped protect those semantics in the implementation.
The aim was not to make every report look identical.
It was to make the underlying decision model consistent while allowing Organisation, Location and Product to keep their own meaning.
10 - SHIPPED SYSTEM
What Sproutfull became
Sproutfull evolved from calculating environmental footprints, to reporting them, to helping users investigate what those results meant.
The same decision-support model now works across three levels of the product.
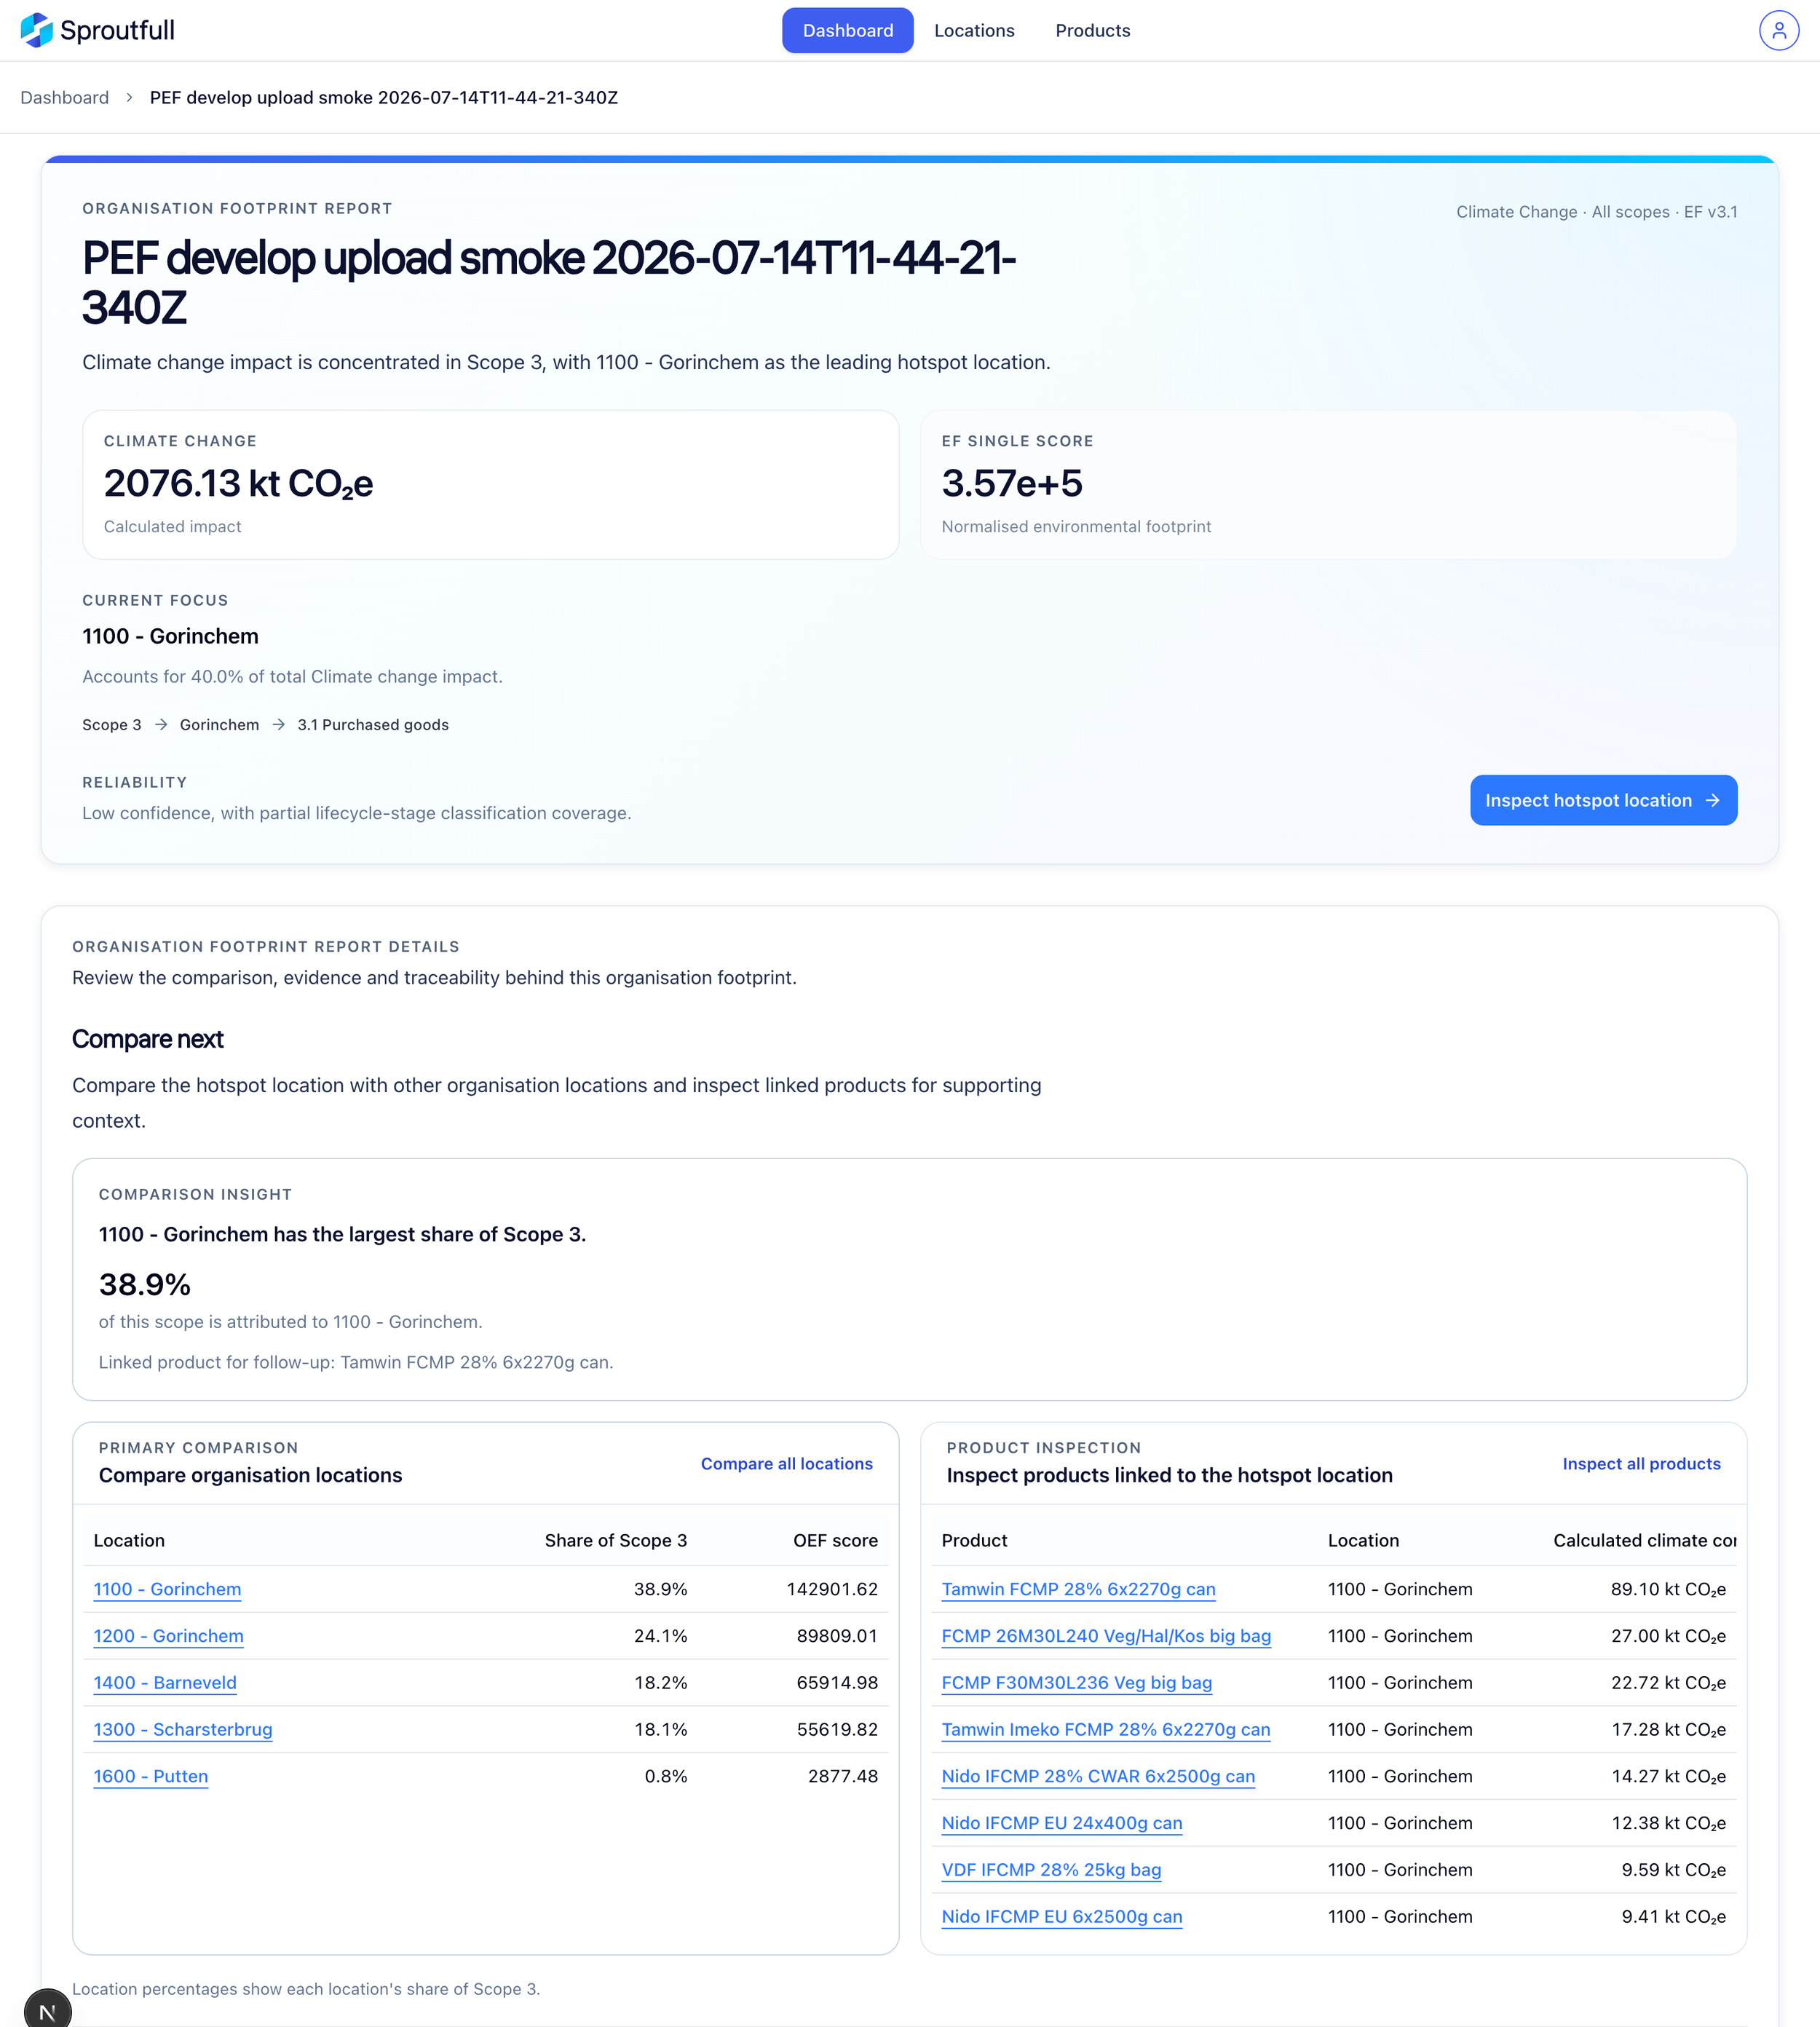
Organisation: Where is impact concentrated, and where should we focus?
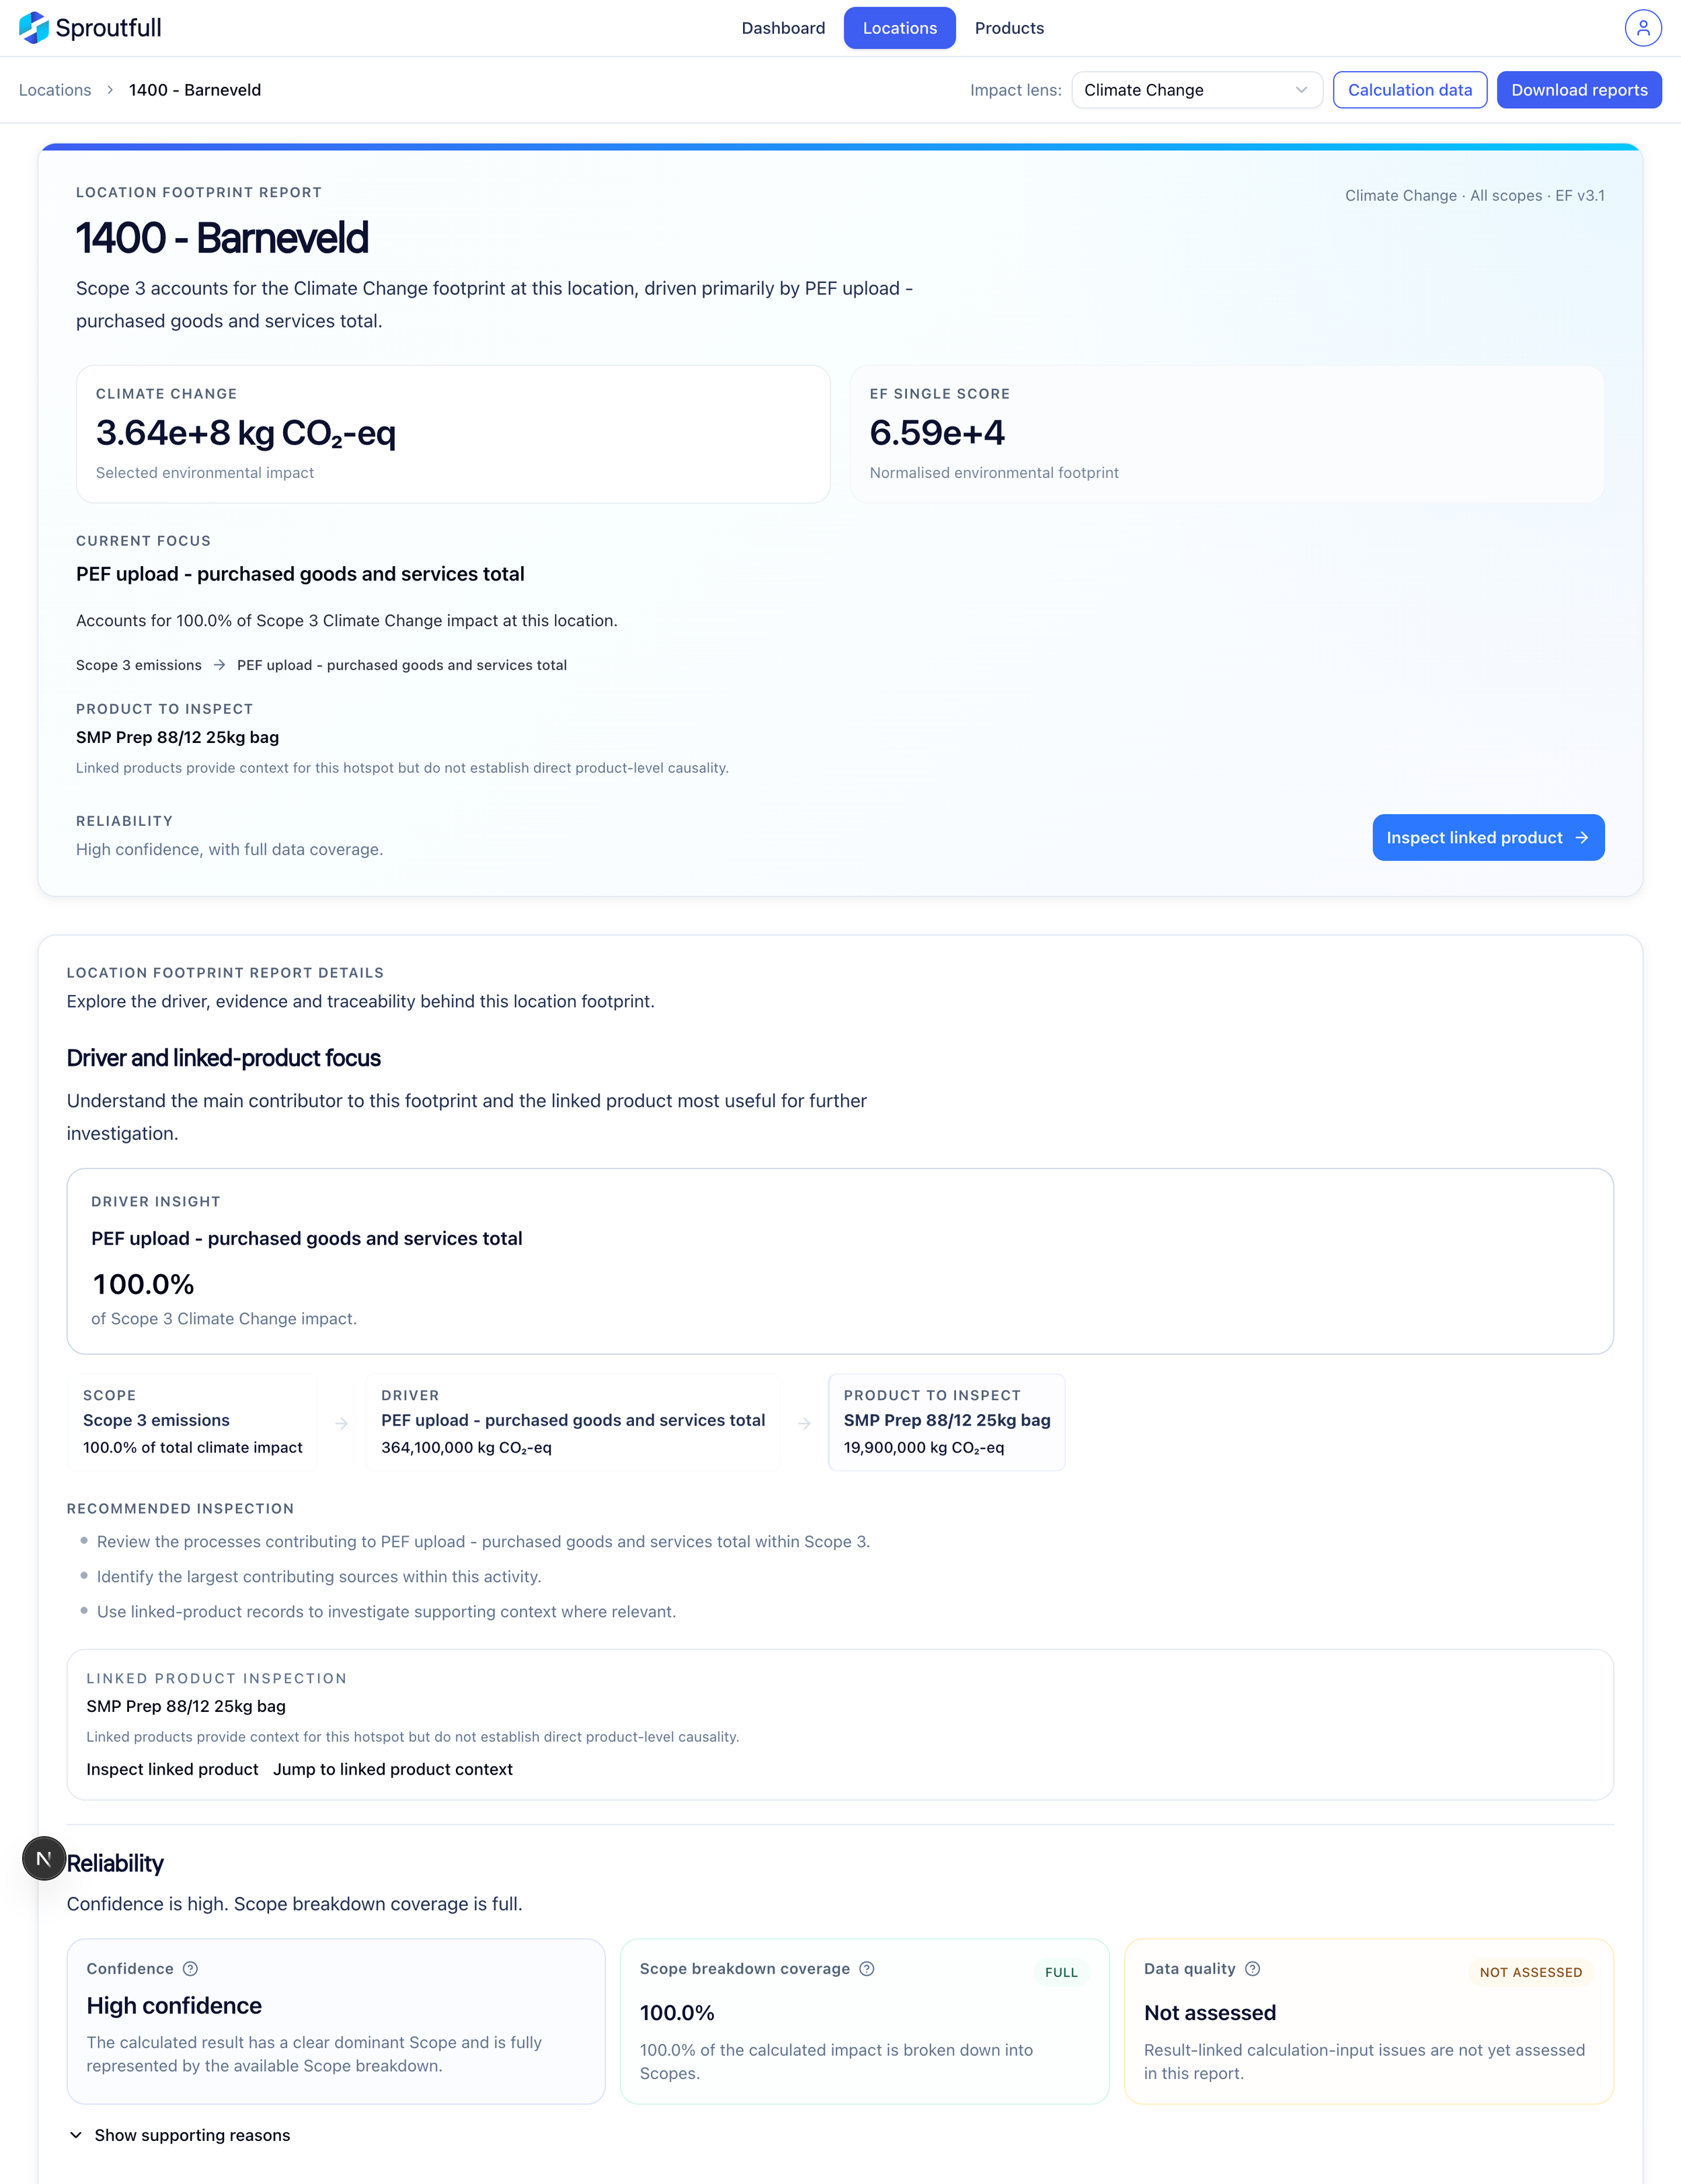
Location: What is driving the footprint here?
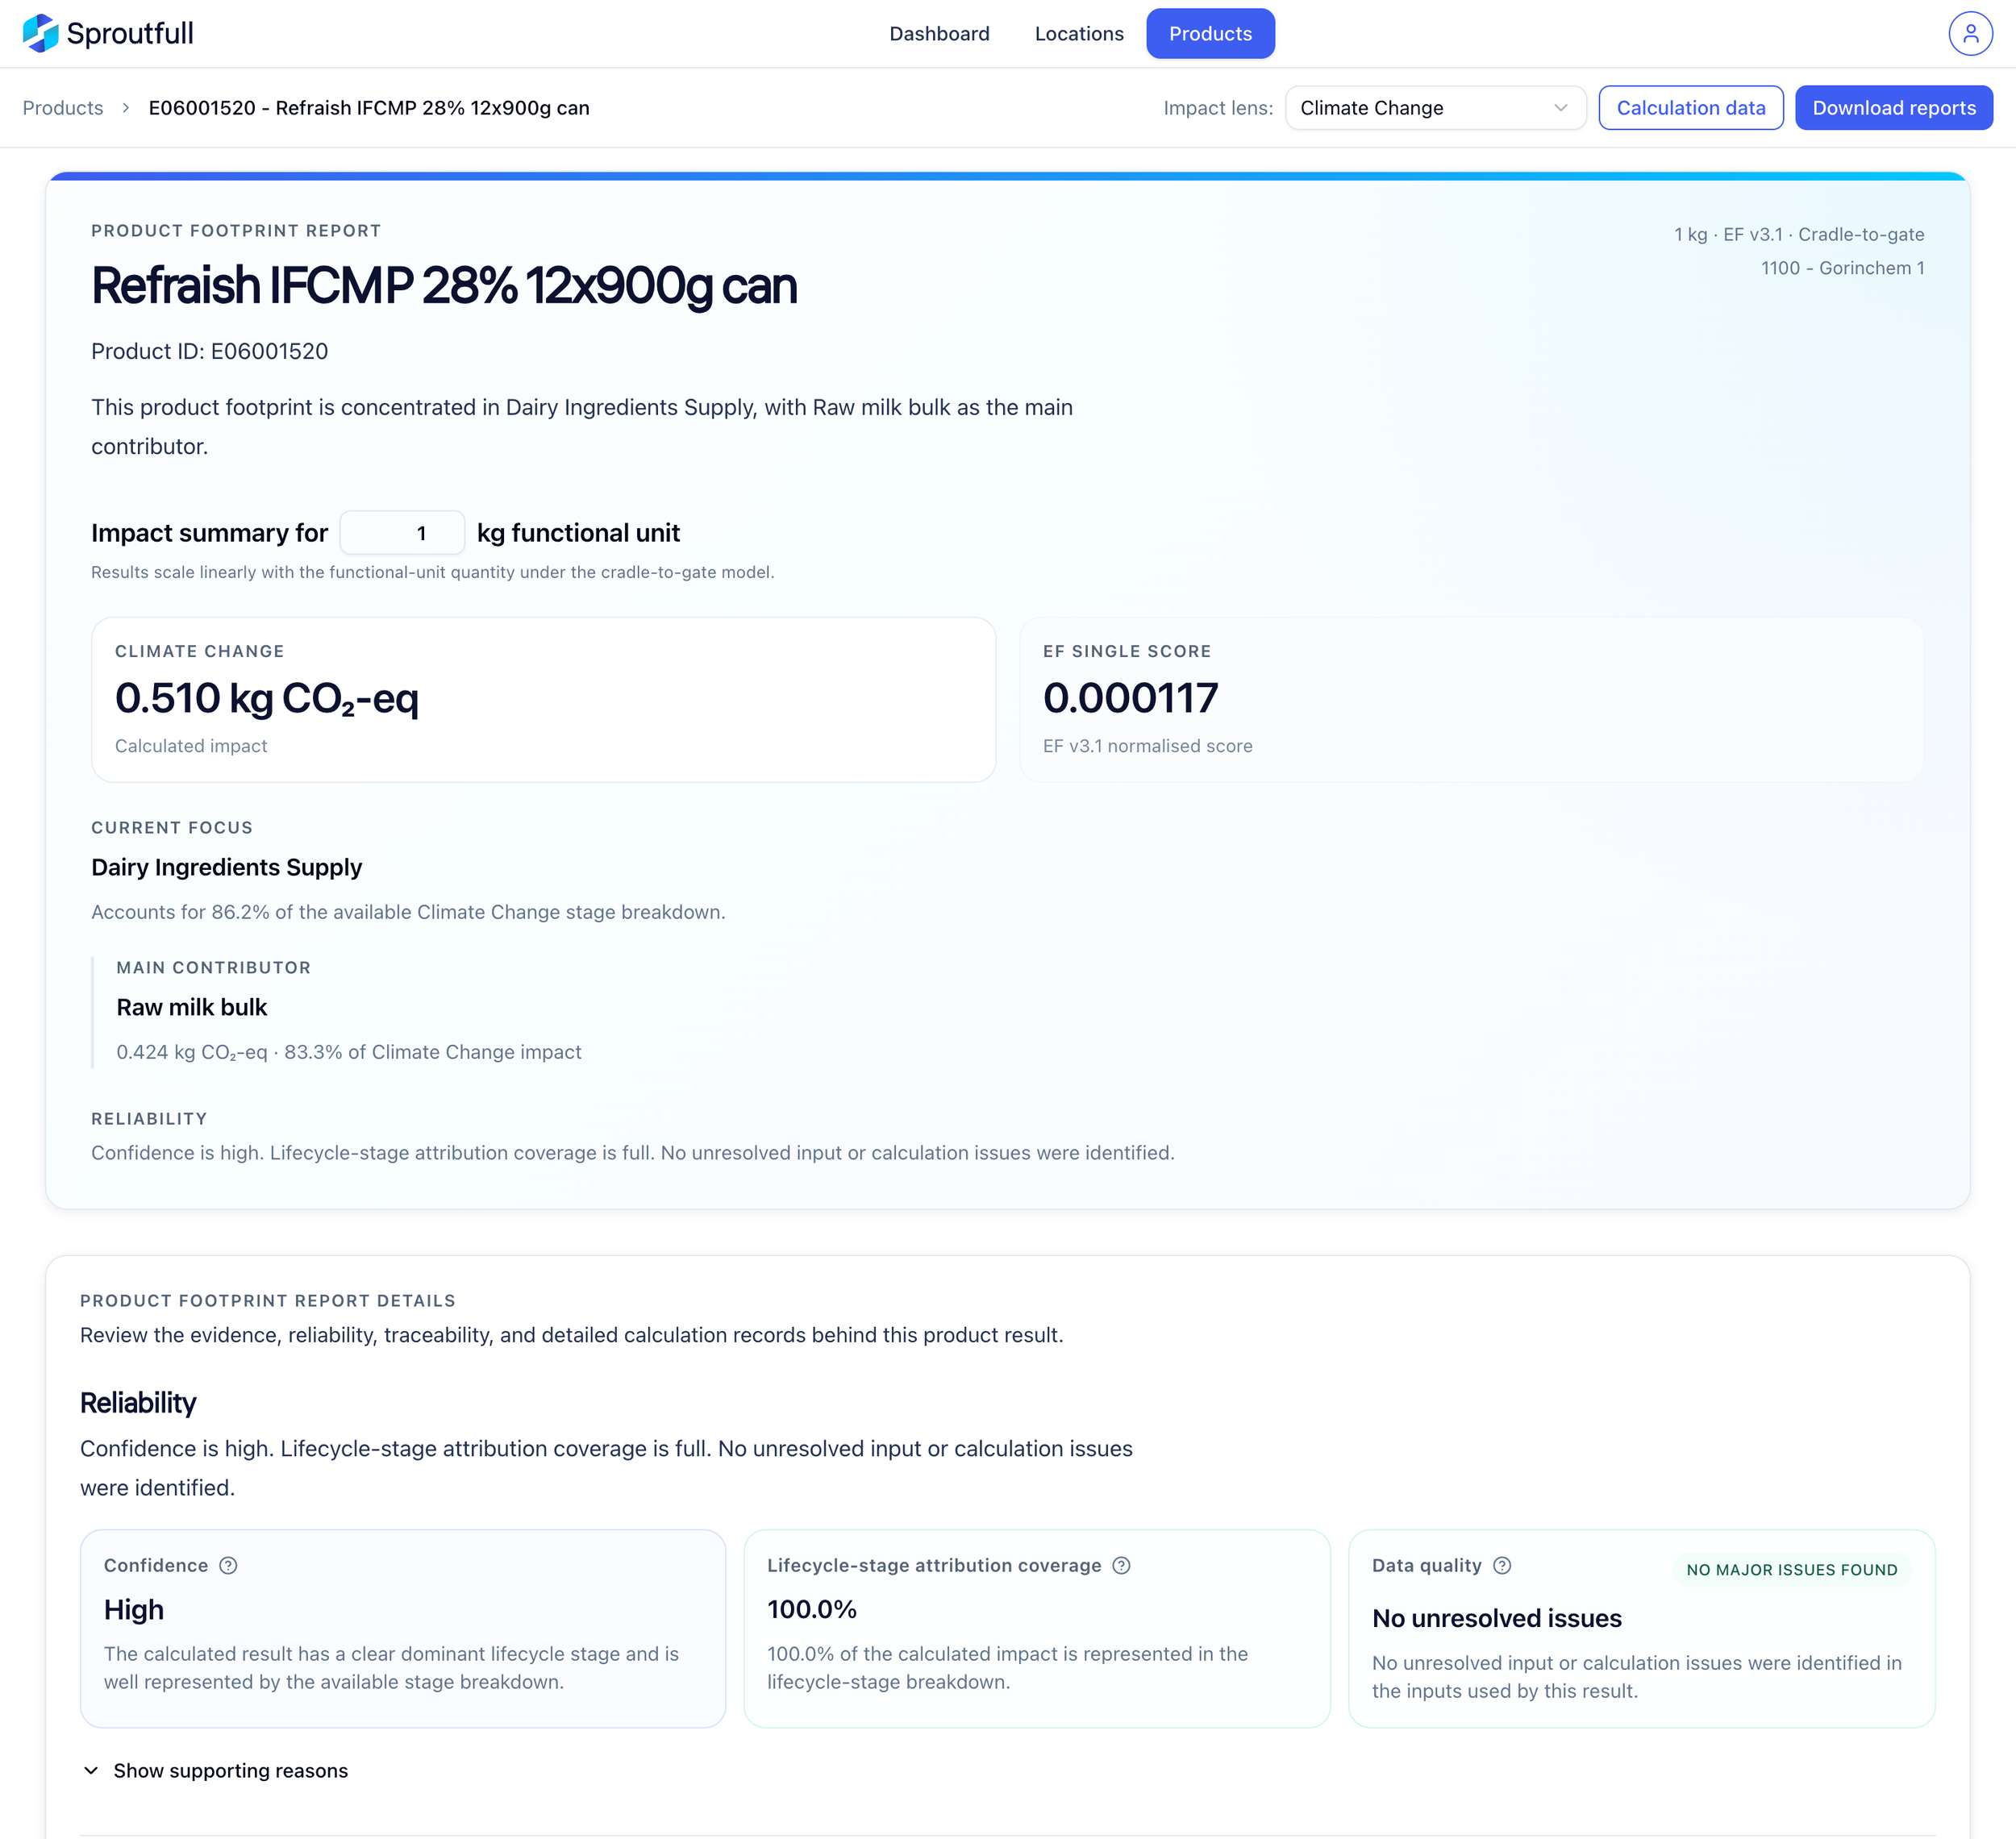
Product: What is contributing most to this footprint?
Each level follows the same underlying logic, while keeping the detail relevant to its own context.
The number became the starting point, not the destination.
11 - CONCLUSION
Outcomes and reflection
The clearest impact was a change in what users could do with the result.
In usability testing, a Vreugdenhil sustainability user could identify the main priority, understand why it had been selected, and use the evidence trail to investigate the underlying contributors. They also connected the reporting model to a practical commercial use case: identifying higher-impact products and considering lower-impact alternatives for customers.
The work also changed the product itself.

For users
A footprint became something they could understand, question and investigate.

For the product
Sproutfull moved from calculation and reporting towards decision support.

For the team
Organisation, Location and Product moved towards one shared reporting model, supported by the Product Book, Playbook, Design System, shared components and automated tests.
The broader shift was from treating environmental reporting as the end of the workflow to making the result useful for investigation, communication and future action.
The project also changed how I think about complexity.
Simplifying a complex product does not always mean removing detail. Sometimes the detail is exactly what people need to make a good judgement.
The question that started the shift still sums up the project best:
What can we do with this number?
Sproutfull became a tool people could think with, not just a place to receive a number.